Estimated Value: $669,000 - $762,000
4
Beds
3
Baths
3,070
Sq Ft
$234/Sq Ft
Est. Value
About This Home
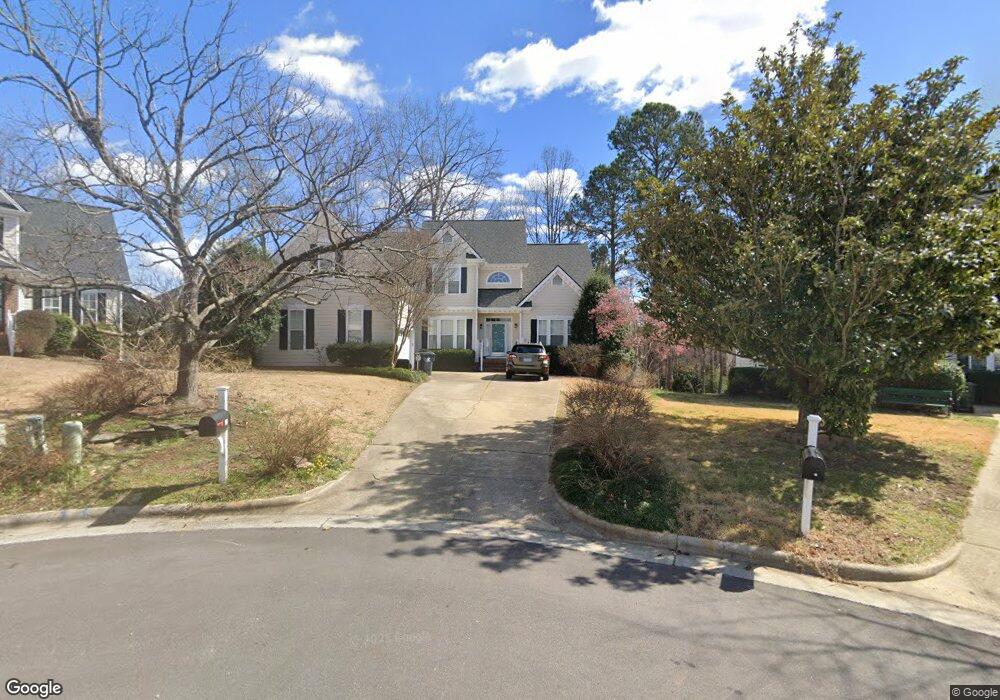
This home is located at 1101 Rosabella Ln, Apex, NC 27502 and is currently estimated at $717,848, approximately $233 per square foot. 1101 Rosabella Ln is a home located in Wake County with nearby schools including Scotts Ridge Elementary School, Apex Middle, and Apex High School.
Ownership History
Date
Name
Owned For
Owner Type
Purchase Details
Closed on
Mar 3, 2016
Sold by
Cromwell Carl K and Cromwell Tisha S
Bought by
Lattke Adriem and Lattke Michelle L
Current Estimated Value
Home Financials for this Owner
Home Financials are based on the most recent Mortgage that was taken out on this home.
Original Mortgage
$300,800
Interest Rate
3.48%
Mortgage Type
New Conventional
Purchase Details
Closed on
May 25, 2001
Sold by
Ewbank David Lee and Ewbank Venetia Hope
Bought by
Cromwell Carl K and Cromwell Tisha S
Home Financials for this Owner
Home Financials are based on the most recent Mortgage that was taken out on this home.
Original Mortgage
$256,000
Interest Rate
7.02%
Create a Home Valuation Report for This Property
The Home Valuation Report is an in-depth analysis detailing your home's value as well as a comparison with similar homes in the area
Home Values in the Area
Average Home Value in this Area
Purchase History
| Date | Buyer | Sale Price | Title Company |
|---|---|---|---|
| Lattke Adriem | $376,000 | None Available | |
| Cromwell Carl K | $275,000 | -- |
Source: Public Records
Mortgage History
| Date | Status | Borrower | Loan Amount |
|---|---|---|---|
| Previous Owner | Lattke Adriem | $300,800 | |
| Previous Owner | Cromwell Carl K | $256,000 |
Source: Public Records
Tax History Compared to Growth
Tax History
| Year | Tax Paid | Tax Assessment Tax Assessment Total Assessment is a certain percentage of the fair market value that is determined by local assessors to be the total taxable value of land and additions on the property. | Land | Improvement |
|---|---|---|---|---|
| 2025 | $5,791 | $660,971 | $190,000 | $470,971 |
| 2024 | $5,661 | $660,971 | $190,000 | $470,971 |
| 2023 | $4,717 | $428,139 | $68,000 | $360,139 |
| 2022 | $4,428 | $428,139 | $68,000 | $360,139 |
| 2021 | $4,259 | $428,139 | $68,000 | $360,139 |
| 2020 | $4,216 | $428,139 | $68,000 | $360,139 |
| 2019 | $3,971 | $347,884 | $68,000 | $279,884 |
| 2018 | $3,740 | $347,884 | $68,000 | $279,884 |
| 2017 | $3,481 | $347,884 | $68,000 | $279,884 |
| 2016 | -- | $347,884 | $68,000 | $279,884 |
| 2015 | $3,240 | $320,562 | $68,000 | $252,562 |
| 2014 | -- | $320,562 | $68,000 | $252,562 |
Source: Public Records
Map
Nearby Homes
- 1105 Capitata Crossing
- 1208 Tartarian Trail
- 1116 Silky Dogwood Trail
- 2008 Silky Dogwood Trail
- 1800 Pierre Place
- 3014 Silky Dogwood Trail
- 402 Village Loop Dr
- 541 Village Loop Dr
- 105 Troyer Place
- 1004 Wild Sonnet Ct
- 209 Homegate Cir
- 0 Jb Morgan Rd Unit 10051948
- 103 Garden Side Way
- 1002 Tribble Gate Ct
- 1209 Haywards Heath Ln
- 2113 Barrier Ridge Way Unit Lot 26
- 2112 Barrier Ridge Way Unit Lot 34
- 2117 Barrier Ridge Way Unit Lot 24
- 102 Darley Dale Loop
- 2124 Barrier Ridge Way
- 1103 Rosabella Ln
- 1003 Alba Trail
- 1100 Rosabella Ln
- 1004 Alba Trail
- 1105 Rosabella Ln
- 1104 Capitata Crossing
- 1102 Rosabella Ln
- 1102 Capitata Crossing
- 1106 Capitata Crossing
- 1002 Alba Trail
- 1104 Rosabella Ln
- 1112 Capitata Crossing
- 1110 Capitata Crossing
- 1202 Tartarian Trail
- 1107 Rosabella Ln
- 1000 Alba Trail
- 1103 Purple Glory Dr
- 1106 Rosabella Ln
- 1200 Tartarian Trail
- 1206 Tartarian Trail