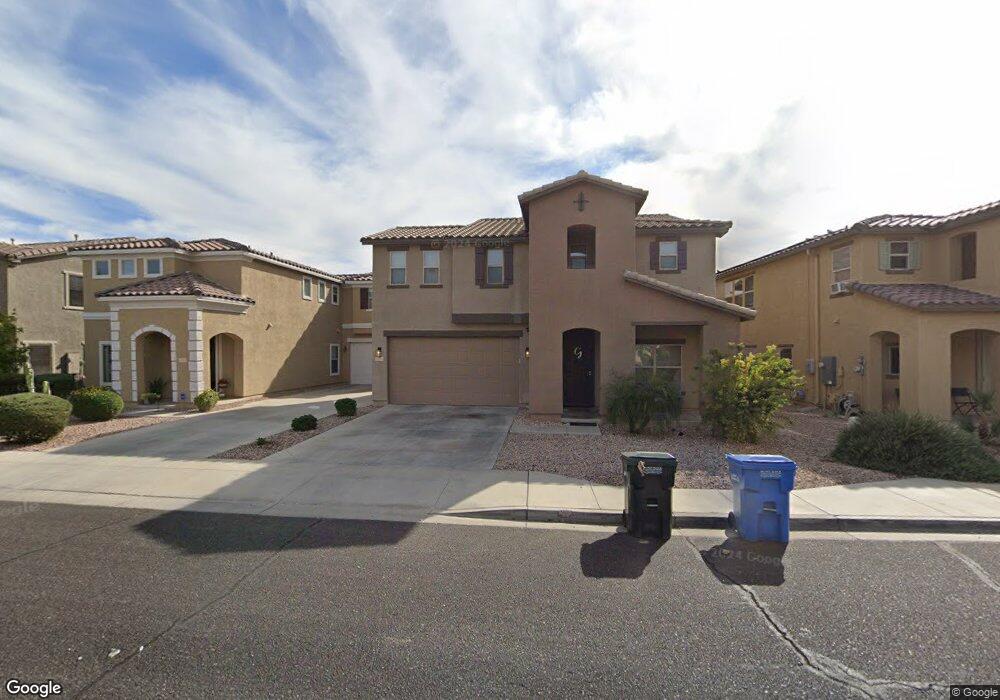
11011 W Pierson St Unit 4 Phoenix, AZ 85037
Villa de Paz NeighborhoodEstimated Value: $380,000 - $447,000
--
Bed
1
Bath
2,507
Sq Ft
$159/Sq Ft
Est. Value
About This Home
This home is located at 11011 W Pierson St Unit 4, Phoenix, AZ 85037 and is currently estimated at $397,692, approximately $158 per square foot. 11011 W Pierson St Unit 4 is a home located in Maricopa County with nearby schools including Copper King Elementary School, Westview High School, and Legacy Traditional School - Phoenix.
Ownership History
Date
Name
Owned For
Owner Type
Purchase Details
Closed on
Nov 21, 2017
Sold by
Gladney Viridiana and Gladney Trevon
Bought by
Gladney Viridiana and Gladney Trevon
Current Estimated Value
Home Financials for this Owner
Home Financials are based on the most recent Mortgage that was taken out on this home.
Original Mortgage
$158,942
Outstanding Balance
$134,568
Interest Rate
4.25%
Mortgage Type
FHA
Estimated Equity
$263,124
Purchase Details
Closed on
Feb 16, 2011
Sold by
Kb Home Sales Phoenix Inc
Bought by
Quintero Viridiana and Gladney Trevon
Home Financials for this Owner
Home Financials are based on the most recent Mortgage that was taken out on this home.
Original Mortgage
$175,437
Interest Rate
4.75%
Mortgage Type
FHA
Create a Home Valuation Report for This Property
The Home Valuation Report is an in-depth analysis detailing your home's value as well as a comparison with similar homes in the area
Home Values in the Area
Average Home Value in this Area
Purchase History
| Date | Buyer | Sale Price | Title Company |
|---|---|---|---|
| Gladney Viridiana | -- | Resource Real Estate Service | |
| Quintero Viridiana | $184,894 | First American Title Ins Co | |
| Kb Home Sales Phoenix Inc | -- | First American Title Ins Co |
Source: Public Records
Mortgage History
| Date | Status | Borrower | Loan Amount |
|---|---|---|---|
| Open | Gladney Viridiana | $158,942 | |
| Closed | Kb Home Sales Phoenix Inc | $175,437 |
Source: Public Records
Tax History Compared to Growth
Tax History
| Year | Tax Paid | Tax Assessment Tax Assessment Total Assessment is a certain percentage of the fair market value that is determined by local assessors to be the total taxable value of land and additions on the property. | Land | Improvement |
|---|---|---|---|---|
| 2025 | $2,999 | $20,524 | -- | -- |
| 2024 | $2,714 | $19,547 | -- | -- |
| 2023 | $2,714 | $28,630 | $5,720 | $22,910 |
| 2022 | $2,606 | $21,530 | $4,300 | $17,230 |
| 2021 | $2,504 | $20,880 | $4,170 | $16,710 |
| 2020 | $2,430 | $19,810 | $3,960 | $15,850 |
| 2019 | $2,412 | $17,380 | $3,470 | $13,910 |
| 2018 | $2,263 | $16,560 | $3,310 | $13,250 |
| 2017 | $2,110 | $15,480 | $3,090 | $12,390 |
| 2016 | $1,933 | $13,810 | $2,760 | $11,050 |
| 2015 | $1,879 | $13,320 | $2,660 | $10,660 |
Source: Public Records
Map
Nearby Homes
- 11009 W Mariposa Dr
- 4714 N 111th Dr
- 4549 N 111th Dr
- 4707 N 112th Glen
- 10817 W Pierson St
- 10911 W Meadowbrook Ave
- 10830 W Minnezona Ave
- 10909 W Minnezona Ave
- 11145 W Campbell Ave
- 4423 N 112th Ave
- 11216 W Sells Dr Unit 2
- 10705 W Montecito Ave
- 11215 W Heatherbrae Dr
- 10509 W Reade Ave
- 4319 N 106th Ave
- 0 W Camelback Rd
- 10428 W Calle de Plata
- 10877 W Marshall Ave
- 4217 N 106th Dr
- 5612 N 109th Ave
- 11007 W Pierson St Unit 4
- 11007 W Pierson St Unit Lot 199
- 11015 W Pierson St
- 11015 W Pierson St Unit Lot 201
- 11006 W Elm St
- 11006 W Elm St Unit Lot 211
- 11003 W Pierson St
- 11019 W Pierson St Unit 4
- 10956 W Elm St Unit 4
- 11010 W Elm St Unit 4
- 11014 W Elm St Unit 4
- 10952 W Elm St
- 10957 W Pierson St
- 11010 W Pierson St
- 11023 W Pierson St Unit 4
- 11023 W Pierson St Unit Lot 203
- 11016 W Pierson St
- 11006 W Pierson St
- 11018 W Elm St Unit 4
- 10948 W Elm St Unit ID1309639P