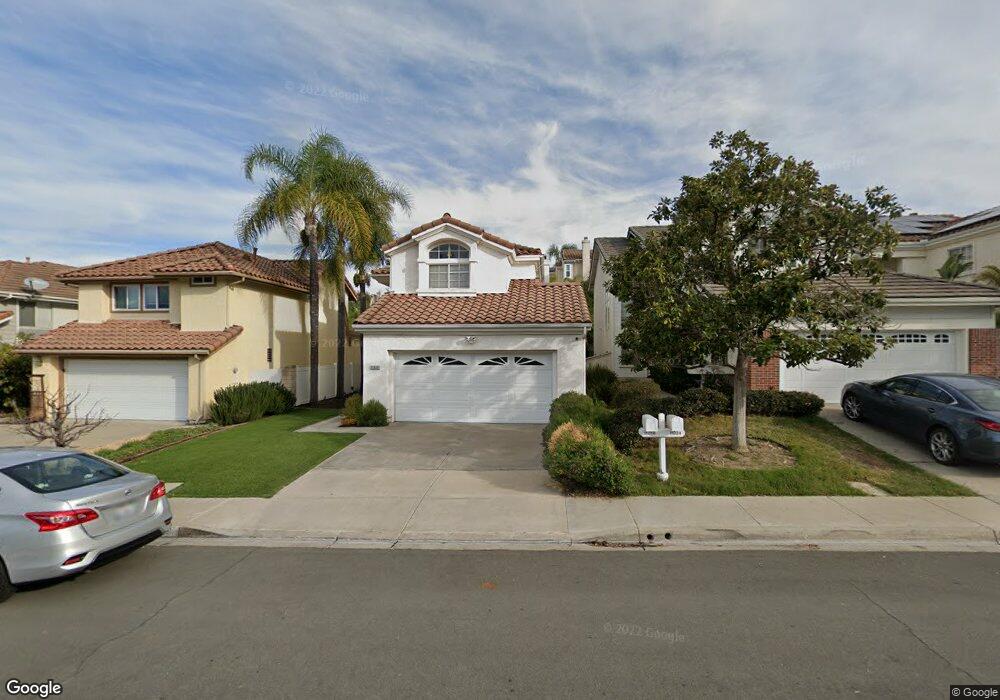
11018 Avenida Playa Veracruz Unit 3 San Diego, CA 92124
Tierrasanta NeighborhoodEstimated Value: $1,289,000 - $1,389,000
4
Beds
3
Baths
1,935
Sq Ft
$691/Sq Ft
Est. Value
About This Home
This home is located at 11018 Avenida Playa Veracruz Unit 3, San Diego, CA 92124 and is currently estimated at $1,337,480, approximately $691 per square foot. 11018 Avenida Playa Veracruz Unit 3 is a home located in San Diego County with nearby schools including Kumeyaay Elementary School, De Portola Middle School, and Farb Middle School.
Ownership History
Date
Name
Owned For
Owner Type
Purchase Details
Closed on
Sep 18, 2003
Sold by
Kinsey Edward W and Kinsey Jane E
Bought by
Tran Dustin Phuong Duy
Current Estimated Value
Home Financials for this Owner
Home Financials are based on the most recent Mortgage that was taken out on this home.
Original Mortgage
$250,000
Interest Rate
5.98%
Mortgage Type
Unknown
Purchase Details
Closed on
Jul 19, 2002
Sold by
Kinsey Edward W and Kinsey Jane E
Bought by
Kinsey Edward W and Kinsey Jane E
Purchase Details
Closed on
Apr 2, 1999
Sold by
Engle Family Trust
Bought by
Kinsey Edward W and Kinsey Jane E
Home Financials for this Owner
Home Financials are based on the most recent Mortgage that was taken out on this home.
Original Mortgage
$277,199
Interest Rate
6.86%
Purchase Details
Closed on
May 6, 1994
Sold by
Engle Gerald A and Engle Colleen P
Bought by
Engle Gerald A and Engle Colleen P
Purchase Details
Closed on
Feb 8, 1991
Create a Home Valuation Report for This Property
The Home Valuation Report is an in-depth analysis detailing your home's value as well as a comparison with similar homes in the area
Home Values in the Area
Average Home Value in this Area
Purchase History
| Date | Buyer | Sale Price | Title Company |
|---|---|---|---|
| Tran Dustin Phuong Duy | $580,000 | Equity Title Company | |
| Kinsey Edward W | -- | -- | |
| Kinsey Edward W | -- | -- | |
| Kinsey Edward W | $308,000 | Guardian Title Company | |
| Engle Gerald A | -- | -- | |
| -- | $236,900 | -- |
Source: Public Records
Mortgage History
| Date | Status | Borrower | Loan Amount |
|---|---|---|---|
| Closed | Tran Dustin Phuong Duy | $250,000 | |
| Previous Owner | Kinsey Edward W | $277,199 |
Source: Public Records
Tax History Compared to Growth
Tax History
| Year | Tax Paid | Tax Assessment Tax Assessment Total Assessment is a certain percentage of the fair market value that is determined by local assessors to be the total taxable value of land and additions on the property. | Land | Improvement |
|---|---|---|---|---|
| 2025 | $9,978 | $824,605 | $234,585 | $590,020 |
| 2024 | $9,978 | $808,437 | $229,986 | $578,451 |
| 2023 | $9,754 | $792,586 | $225,477 | $567,109 |
| 2022 | $9,489 | $777,046 | $221,056 | $555,990 |
| 2021 | $9,418 | $761,811 | $216,722 | $545,089 |
| 2020 | $9,302 | $754,000 | $214,500 | $539,500 |
| 2019 | $8,836 | $715,000 | $200,000 | $515,000 |
| 2018 | $8,251 | $700,000 | $196,000 | $504,000 |
| 2017 | $7,979 | $680,000 | $191,000 | $489,000 |
| 2016 | $7,772 | $660,000 | $186,000 | $474,000 |
| 2015 | $7,420 | $630,000 | $178,000 | $452,000 |
| 2014 | $7,447 | $630,000 | $178,000 | $452,000 |
Source: Public Records
Map
Nearby Homes
- 4989 Corte Playa Encino
- 5238 Camino Playa Malaga
- 10908 Avenida Playa Veracruz
- 6161 Calle Mariselda Unit 408
- 6140 Calle Mariselda Unit 102
- 4755 Mayita Way
- 10828 Lamentin Ct Unit 313
- 10812 Lamentin Ct Unit 312
- 11048 Portobelo Dr
- 11056 Portobelo Dr
- 11080 Portobelo Dr
- 11086 Portobelo Dr Unit 125
- 4375 Calle de Vida
- 10889 Lamentin Ct
- 10834 Caravelle Place
- 11136 Portobelo Dr
- 11116 Portobelo Dr
- 4734 Ocana Place Unit 1
- 11350 Camino Playa Cancun Unit 3
- 5137 Abuela Dr
- 11024 Avenida Playa Veracruz
- 11012 Avenida Playa Veracruz
- 11028 Avenida Playa Veracruz Unit 3
- 11008 Avenida Playa Veracruz
- 4911 Corte Playa Encino
- 11034 Avenida Playa Veracruz
- 11004 Avenida Playa Veracruz
- 4906 Corte Playa de Castilla
- 4919 Corte Playa Encino
- 4918 Corte Playa de Castilla
- 11038 Avenida Playa Veracruz
- 4924 Corte Playa de Castilla
- 4927 Corte Playa Encino
- 11044 Avenida Playa Veracruz
- 4936 Corte Playa de Castilla
- 10994 Avenida Playa Veracruz Unit 2
- 4935 Corte Playa Encino
- 11058 Avenida Playa Veracruz
- 4944 Corte Playa de Castilla
- 10990 Avenida Playa Veracruz