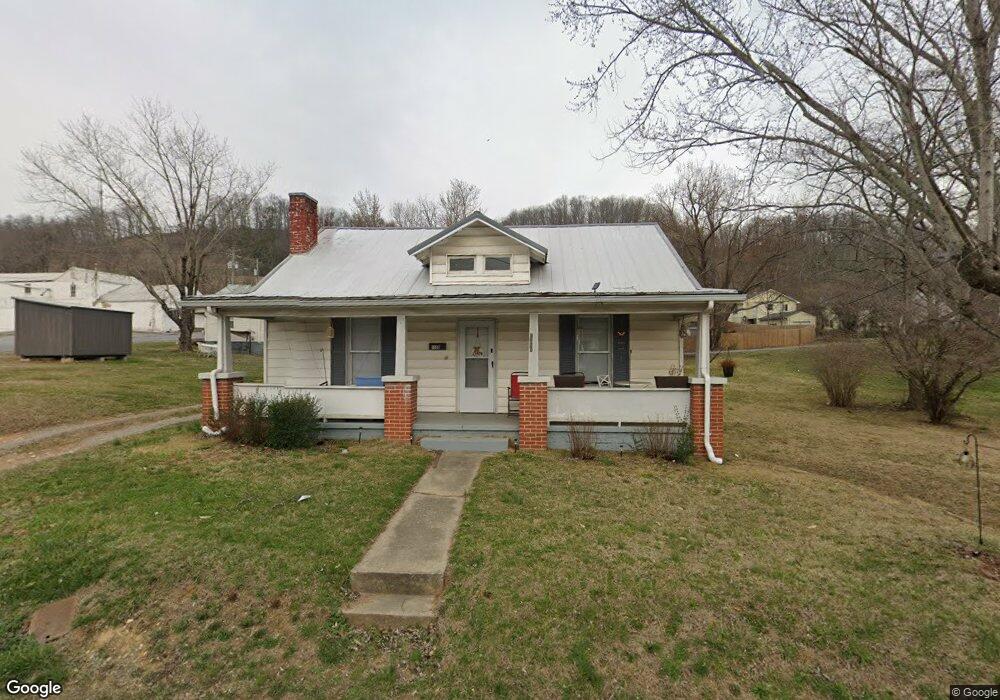
1103 E Main St Johnson City, TN 37601
Keystone NeighborhoodEstimated Value: $121,000 - $202,000
2
Beds
1
Bath
1,178
Sq Ft
$133/Sq Ft
Est. Value
About This Home
This home is located at 1103 E Main St, Johnson City, TN 37601 and is currently estimated at $157,224, approximately $133 per square foot. 1103 E Main St is a home located in Washington County with nearby schools including Mountain View Elementary School, Indian Trail Middle School, and Science Hill High School.
Ownership History
Date
Name
Owned For
Owner Type
Purchase Details
Closed on
Aug 23, 2023
Sold by
Community Diamond Investments Llc
Bought by
Shell Teddy and Guinn Penelope
Current Estimated Value
Home Financials for this Owner
Home Financials are based on the most recent Mortgage that was taken out on this home.
Original Mortgage
$139,680
Outstanding Balance
$136,585
Interest Rate
6.96%
Mortgage Type
New Conventional
Estimated Equity
$20,639
Purchase Details
Closed on
Dec 29, 2021
Sold by
Adams Robin H and Hunt Chad
Bought by
Community Diamond Investments Llc
Home Financials for this Owner
Home Financials are based on the most recent Mortgage that was taken out on this home.
Original Mortgage
$60,000
Interest Rate
3.12%
Mortgage Type
Purchase Money Mortgage
Purchase Details
Closed on
Jun 12, 2013
Sold by
Honeycutt Thelma
Bought by
Smith Lisa D
Create a Home Valuation Report for This Property
The Home Valuation Report is an in-depth analysis detailing your home's value as well as a comparison with similar homes in the area
Home Values in the Area
Average Home Value in this Area
Purchase History
| Date | Buyer | Sale Price | Title Company |
|---|---|---|---|
| Shell Teddy | $144,000 | Classic Title | |
| Community Diamond Investments Llc | $75,000 | None Available | |
| Smith Lisa D | $35,000 | -- |
Source: Public Records
Mortgage History
| Date | Status | Borrower | Loan Amount |
|---|---|---|---|
| Open | Shell Teddy | $139,680 | |
| Previous Owner | Community Diamond Investments Llc | $60,000 |
Source: Public Records
Tax History
| Year | Tax Paid | Tax Assessment Tax Assessment Total Assessment is a certain percentage of the fair market value that is determined by local assessors to be the total taxable value of land and additions on the property. | Land | Improvement |
|---|---|---|---|---|
| 2025 | $543 | $31,775 | $9,375 | $22,400 |
| 2024 | $543 | $31,775 | $9,375 | $22,400 |
| 2022 | $432 | $20,075 | $4,500 | $15,575 |
| 2021 | $779 | $20,075 | $4,500 | $15,575 |
| 2020 | $775 | $20,075 | $4,500 | $15,575 |
| 2019 | $427 | $20,075 | $4,500 | $15,575 |
| 2018 | $766 | $17,950 | $4,500 | $13,450 |
| 2017 | $766 | $17,950 | $4,500 | $13,450 |
| 2016 | $763 | $17,950 | $4,500 | $13,450 |
| 2015 | $646 | $17,950 | $4,500 | $13,450 |
| 2014 | $646 | $17,950 | $4,500 | $13,450 |
Source: Public Records
Map
Nearby Homes
- 505 Orleans St
- Tbd Orleans St
- 630 E Maple St
- 824 E Myrtle Ave
- 1101 Afton St
- 32 Taylor Ridge Ct
- 900 Grover St
- 1106 Fremont Dr
- 106 Water St
- 1206 E Myrtle Ave
- 805 E Maple St
- 411 E Chestnut St
- 1507 E Millard St
- 1704 Orlando Dr
- 1400 Stoneybrook Dr
- 1501 E Fairview Ave
- 1707 Daytona Dr
- 1512 E Fairview Ave
- 1610 E Millard St
- 1502 E Myrtle Ave
Your Personal Tour Guide
Ask me questions while you tour the home.