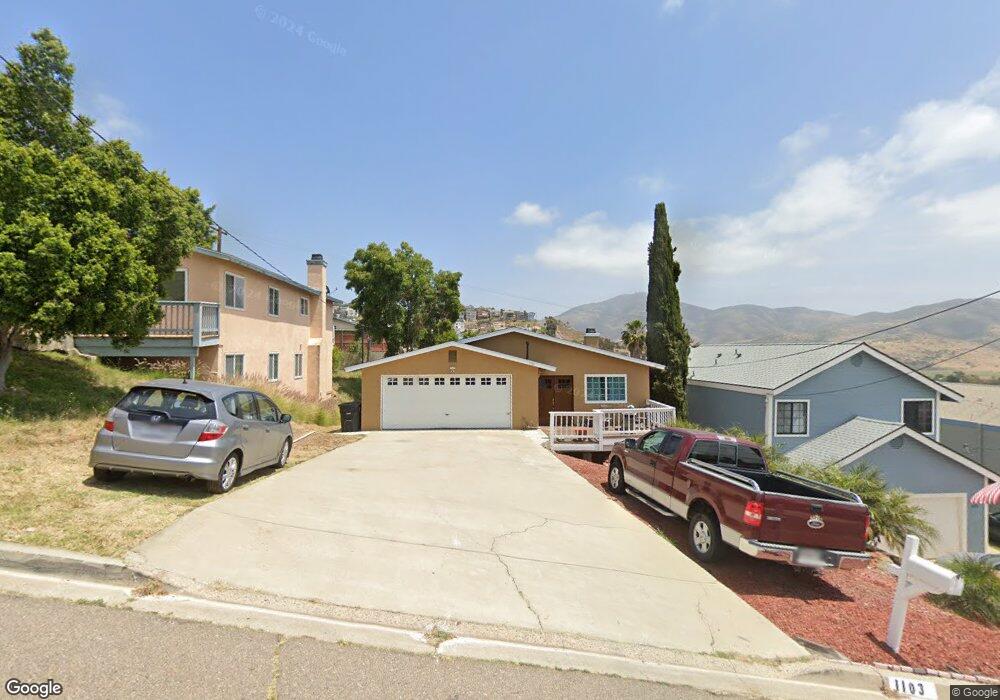
1103 Maria Ave Spring Valley, CA 91977
Estimated Value: $648,000 - $891,000
3
Beds
2
Baths
--
Sq Ft
6,578
Sq Ft Lot
About This Home
This home is located at 1103 Maria Ave, Spring Valley, CA 91977 and is currently estimated at $757,450. 1103 Maria Ave is a home located in San Diego County with nearby schools including Science, Technology, Engineering, Arts, And Math Academy, Sweetwater Springs Elementary School, and Monte Vista High School.
Ownership History
Date
Name
Owned For
Owner Type
Purchase Details
Closed on
Jul 29, 2025
Sold by
Battle-Quarles Sheila L
Bought by
Smith Jasmine and Jenkins James
Current Estimated Value
Home Financials for this Owner
Home Financials are based on the most recent Mortgage that was taken out on this home.
Original Mortgage
$638,226
Outstanding Balance
$637,683
Interest Rate
6.81%
Mortgage Type
FHA
Estimated Equity
$119,767
Purchase Details
Closed on
Apr 29, 1999
Sold by
Harendra Gandhi
Bought by
Quarles John L and Battle Quarles Sheila I
Home Financials for this Owner
Home Financials are based on the most recent Mortgage that was taken out on this home.
Original Mortgage
$142,762
Interest Rate
7.05%
Mortgage Type
VA
Purchase Details
Closed on
Feb 14, 1994
Sold by
Christiansen Bent and Christiansen Ingeborg M
Bought by
Gandhi Harendra and Gandhi Yellow
Create a Home Valuation Report for This Property
The Home Valuation Report is an in-depth analysis detailing your home's value as well as a comparison with similar homes in the area
Home Values in the Area
Average Home Value in this Area
Purchase History
| Date | Buyer | Sale Price | Title Company |
|---|---|---|---|
| Smith Jasmine | $650,000 | Ticor Title Company | |
| Quarles John L | $179,000 | Fidelity National Title | |
| Gandhi Harendra | -- | -- |
Source: Public Records
Mortgage History
| Date | Status | Borrower | Loan Amount |
|---|---|---|---|
| Open | Smith Jasmine | $638,226 | |
| Previous Owner | Quarles John L | $142,762 |
Source: Public Records
Tax History Compared to Growth
Tax History
| Year | Tax Paid | Tax Assessment Tax Assessment Total Assessment is a certain percentage of the fair market value that is determined by local assessors to be the total taxable value of land and additions on the property. | Land | Improvement |
|---|---|---|---|---|
| 2025 | $3,799 | $280,594 | $94,049 | $186,545 |
| 2024 | $3,799 | $275,093 | $92,205 | $182,888 |
| 2023 | $3,675 | $269,700 | $90,398 | $179,302 |
| 2022 | $3,608 | $264,413 | $88,626 | $175,787 |
| 2021 | $3,569 | $259,230 | $86,889 | $172,341 |
| 2020 | $3,419 | $256,573 | $85,999 | $170,574 |
| 2019 | $3,363 | $251,543 | $84,313 | $167,230 |
| 2018 | $3,252 | $246,611 | $82,660 | $163,951 |
| 2017 | $3,166 | $241,777 | $81,040 | $160,737 |
| 2016 | $3,044 | $237,037 | $79,451 | $157,586 |
| 2015 | $3,024 | $233,477 | $78,258 | $155,219 |
| 2014 | $2,970 | $228,905 | $76,726 | $152,179 |
Source: Public Records
Map
Nearby Homes
- 1116 Maria Ave
- 1214 Maria Ave
- 1239 La Presa Ave
- 935 Ramona Ave
- 1311 La Presa Ave
- 9559 Chestnut St
- 1421 Maria Ave
- 1015-17 Grand Ave
- 1412 San Miguel Ave
- 1312 Portola Ave
- 1520 Ramona Ave
- 0 Grand Ave Unit PW25084786
- 9258 Birch St
- 0 La Mesa Ave Unit PTP2506440
- 1637 Paraiso Ave
- 9240 Harness St Unit 1
- 9240 Harness St
- 1656 Maria Ave
- 757 Grand Ave
- 1649 La Presa Ave
- 1107 Maria Ave
- 1031 Maria Ave
- 1027 Maria Ave
- 1111 Maria Ave
- 1104 Buena Vista Ave
- 1032 Buena Vista Ave
- 1108 Buena Vista Ave
- 1021 Maria Ave
- 1115 Maria Ave
- 1026 Buena Vista Ave
- 1112 Buena Vista Ave
- 1036 Maria Ave
- 1032 Maria Ave
- 1110 Maria Ave
- 1022 Buena Vista Ave
- 1118 Buena Vista Ave
- 1015 Maria Ave
- 1121 Maria Ave
- 1028 Maria Ave
- 0 Maria Ave Unit NP24076431