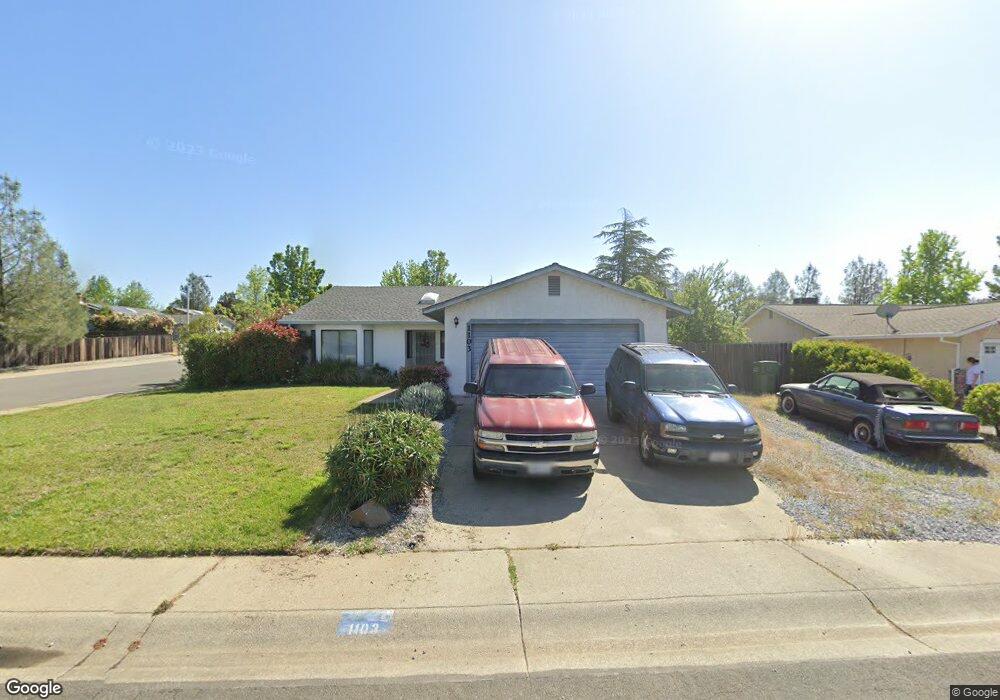
1103 Nighthawk Ln Unit ONE Redding, CA 96003
Lema Ranch NeighborhoodEstimated Value: $385,944 - $415,000
4
Beds
2
Baths
1,660
Sq Ft
$241/Sq Ft
Est. Value
About This Home
This home is located at 1103 Nighthawk Ln Unit ONE, Redding, CA 96003 and is currently estimated at $399,486, approximately $240 per square foot. 1103 Nighthawk Ln Unit ONE is a home located in Shasta County with nearby schools including Columbia Elementary School, Mountain View Middle School, and Foothill High School.
Ownership History
Date
Name
Owned For
Owner Type
Purchase Details
Closed on
Nov 19, 2020
Sold by
Fisher Kathleen
Bought by
Fisher Kathleen and Fisher Dana
Current Estimated Value
Home Financials for this Owner
Home Financials are based on the most recent Mortgage that was taken out on this home.
Original Mortgage
$228,250
Outstanding Balance
$202,181
Interest Rate
2.8%
Mortgage Type
New Conventional
Estimated Equity
$197,305
Purchase Details
Closed on
Jul 21, 2008
Sold by
Fisher Dana E
Bought by
Fisher Kathleen
Home Financials for this Owner
Home Financials are based on the most recent Mortgage that was taken out on this home.
Original Mortgage
$186,252
Interest Rate
6.31%
Mortgage Type
FHA
Purchase Details
Closed on
Sep 6, 2000
Sold by
Weston James C and Weston Kathie A
Bought by
Mcreynolds Alma
Create a Home Valuation Report for This Property
The Home Valuation Report is an in-depth analysis detailing your home's value as well as a comparison with similar homes in the area
Home Values in the Area
Average Home Value in this Area
Purchase History
| Date | Buyer | Sale Price | Title Company |
|---|---|---|---|
| Fisher Kathleen | -- | First American Title | |
| Fisher Kathleen | -- | First American Title Company | |
| Muir Marjorie F | $238,500 | First American Title Company | |
| Mcreynolds Alma | $117,500 | Alliance Title Company |
Source: Public Records
Mortgage History
| Date | Status | Borrower | Loan Amount |
|---|---|---|---|
| Open | Fisher Kathleen | $228,250 | |
| Previous Owner | Muir Marjorie F | $186,252 |
Source: Public Records
Tax History
| Year | Tax Paid | Tax Assessment Tax Assessment Total Assessment is a certain percentage of the fair market value that is determined by local assessors to be the total taxable value of land and additions on the property. | Land | Improvement |
|---|---|---|---|---|
| 2025 | $3,108 | $307,116 | $115,891 | $191,225 |
| 2024 | $3,122 | $301,095 | $113,619 | $187,476 |
| 2023 | $3,122 | $295,192 | $111,392 | $183,800 |
| 2022 | $3,017 | $289,405 | $109,208 | $180,197 |
| 2021 | $2,995 | $283,731 | $107,067 | $176,664 |
| 2020 | $2,971 | $280,823 | $105,970 | $174,853 |
| 2019 | $2,901 | $275,318 | $103,893 | $171,425 |
| 2018 | $2,923 | $269,920 | $101,856 | $168,064 |
| 2017 | $2,793 | $250,000 | $50,000 | $200,000 |
| 2016 | $2,446 | $230,000 | $45,000 | $185,000 |
| 2015 | $2,282 | $215,000 | $50,000 | $165,000 |
| 2014 | $2,160 | $205,000 | $40,000 | $165,000 |
Source: Public Records
Map
Nearby Homes
- 965 Willow Brook Ln
- 1090 Gibralter Rd
- 1110 Grouse Dr
- 1637 French Lace Ln
- 1285 Lancers Ln
- 1088 Burton Dr
- 1939 Cameo Ct
- 2182 Cadjew St
- 2093 Victor Ave
- 550 Armando Ave
- 10033 Abernathy Ln
- 1230 Whistling Dr
- 547 Casa Buena St
- 2385 Shining Star Way
- 667 Reddington Dr
- 332 Franciscan Trail
- 790 Volcano View Trail
- 771 Flower Ash Ln
- 2199 Princeton Way
- 825 Mission Sierra Ct
- 1103 Nighthawk Ln
- 1135 Nighthawk Ln
- 2135 Osprey Ln
- 1095 Nighthawk Ln
- 1167 Nighthawk Ln
- 2136 Osprey Ln
- 2153 Osprey Ln
- 1108 Nighthawk Ln
- 1156 Nighthawk Ln
- 1079 Nighthawk Ln
- 1072 Nighthawk Ln
- 1191 Peregrine Way
- 1199 Nighthawk Ln
- 2154 Osprey Ln
- 1060 Nighthawk Ln
- 2171 Osprey Ln
- 1175 Peregrine Way
- 1067 Nighthawk Ln
- 2172 Osprey Ln
- 1048 Nighthawk Ln
Your Personal Tour Guide
Ask me questions while you tour the home.