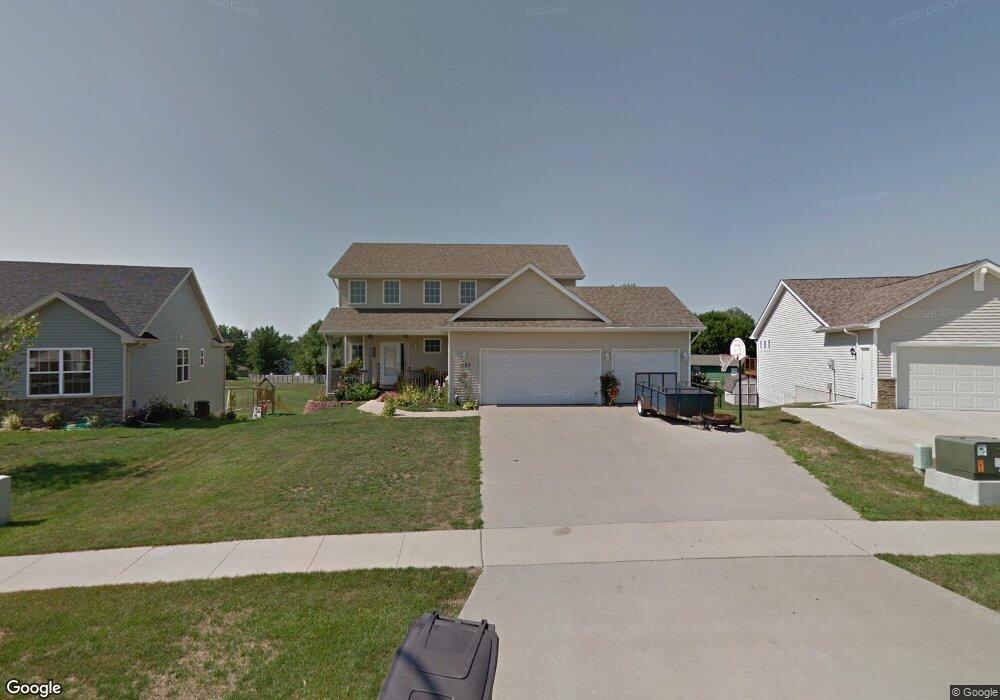
1103 Rolling Hills Ct Norwalk, IA 50211
Estimated Value: $393,000 - $415,341
4
Beds
4
Baths
2,078
Sq Ft
$193/Sq Ft
Est. Value
About This Home
This home is located at 1103 Rolling Hills Ct, Norwalk, IA 50211 and is currently estimated at $400,335, approximately $192 per square foot. 1103 Rolling Hills Ct is a home located in Warren County with nearby schools including Oviatt Elementary School, Orchard Hills Elementary School, and Lakewood Elementary School.
Ownership History
Date
Name
Owned For
Owner Type
Purchase Details
Closed on
May 7, 2007
Sold by
Albright Developement Corp
Bought by
Meneough Matt and Meneough Laura A
Current Estimated Value
Home Financials for this Owner
Home Financials are based on the most recent Mortgage that was taken out on this home.
Original Mortgage
$235,500
Outstanding Balance
$142,859
Interest Rate
6.21%
Mortgage Type
New Conventional
Estimated Equity
$257,476
Purchase Details
Closed on
Dec 20, 2006
Sold by
Vista Real Estate And Investment Corpora
Bought by
Albright Development Corp
Home Financials for this Owner
Home Financials are based on the most recent Mortgage that was taken out on this home.
Original Mortgage
$204,800
Interest Rate
6.24%
Mortgage Type
Construction
Purchase Details
Closed on
Oct 20, 2005
Sold by
Ground Investments Inc
Bought by
Vista Real Estate & Investment Corp
Create a Home Valuation Report for This Property
The Home Valuation Report is an in-depth analysis detailing your home's value as well as a comparison with similar homes in the area
Home Values in the Area
Average Home Value in this Area
Purchase History
| Date | Buyer | Sale Price | Title Company |
|---|---|---|---|
| Meneough Matt | $352,500 | None Available | |
| Albright Development Corp | $62,250 | None Available | |
| Vista Real Estate & Investment Corp | $172,500 | None Available |
Source: Public Records
Mortgage History
| Date | Status | Borrower | Loan Amount |
|---|---|---|---|
| Open | Meneough Matt | $235,500 | |
| Previous Owner | Albright Development Corp | $204,800 |
Source: Public Records
Tax History Compared to Growth
Tax History
| Year | Tax Paid | Tax Assessment Tax Assessment Total Assessment is a certain percentage of the fair market value that is determined by local assessors to be the total taxable value of land and additions on the property. | Land | Improvement |
|---|---|---|---|---|
| 2025 | $6,812 | $374,500 | $73,700 | $300,800 |
| 2024 | $6,800 | $372,300 | $59,400 | $312,900 |
| 2023 | $6,866 | $372,300 | $59,400 | $312,900 |
| 2022 | $6,844 | $316,400 | $59,400 | $257,000 |
| 2021 | $6,508 | $316,400 | $59,400 | $257,000 |
| 2020 | $6,508 | $284,200 | $45,000 | $239,200 |
| 2019 | $6,562 | $284,200 | $45,000 | $239,200 |
| 2018 | $6,356 | $281,000 | $0 | $0 |
| 2017 | $6,076 | $281,000 | $0 | $0 |
| 2016 | $6,024 | $259,800 | $0 | $0 |
| 2015 | $6,024 | $259,800 | $0 | $0 |
| 2014 | $5,600 | $225,600 | $0 | $0 |
Source: Public Records
Map
Nearby Homes
- 2528 Shady Lane Dr
- 3124 Shady Lane Dr
- 3118 Shady Lane Dr
- 3112 Shady Lane Dr
- 3106 Shady Lane Dr
- 3100 Shady Lane Dr
- 3032 Shady Lane Dr
- 3026 Shady Lane Dr
- 3020 Shady Lane Dr
- 3014 Shady Lane Dr
- 3008 Shady Lane Dr
- 3002 Shady Lane Dr
- 2930 Shady Lane Dr
- 2924 Shady Lane Dr
- 2918 Shady Lane Dr
- 2912 Shady Lane Dr
- 2906 Shady Lane Dr
- 2900 Shady Lane Dr
- 3003 Shady Lane Dr
- 3009 Shady Lane Dr
- 1035 Rolling Hills Ct
- 1109 Rolling Hills Ct
- 1016 Hunter Dr
- 1029 Rolling Hills Ct
- 1113 Rolling Hills Ct
- 1022 Hunter Dr
- 1010 Hunter Dr
- 2403 Green Hills Dr
- 1102 Hunter Dr
- 1004 Hunter Dr
- 1106 Rolling Hills Ct
- 1117 Rolling Hills Ct
- 1025 Rolling Hills Ct
- 2402 Green Hills Dr
- 2407 Green Hills Dr
- 1020 Rolling Hills Ct
- 1108 Hunter Dr
- 928 Hunter Dr
- 2411 Green Hills Dr