Estimated Value: $153,000 - $194,799
3
Beds
2
Baths
1,468
Sq Ft
$117/Sq Ft
Est. Value
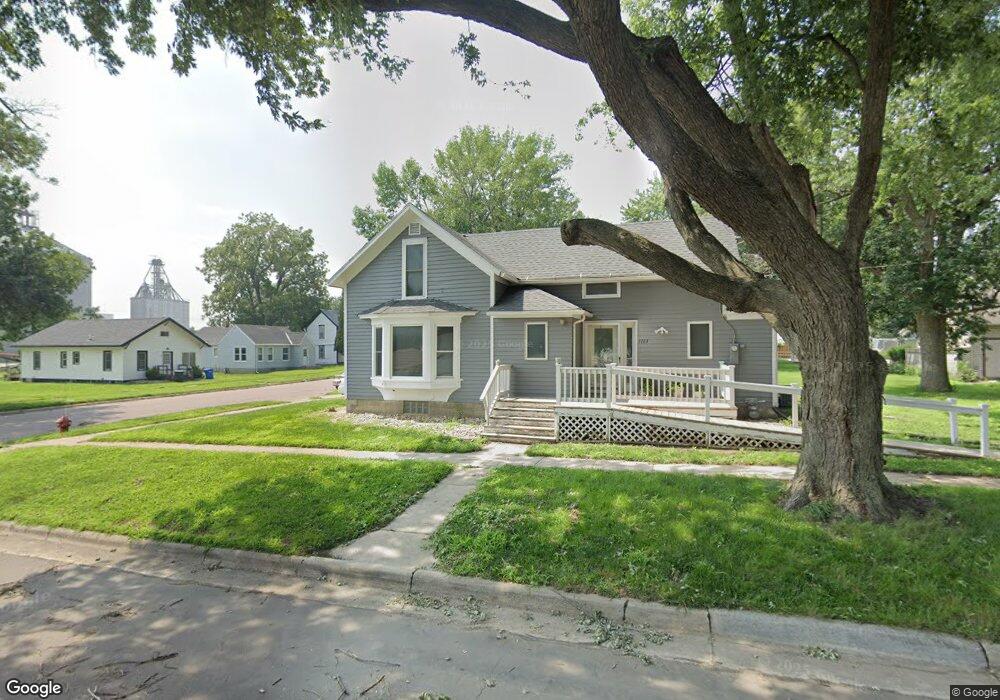
About This Home
This home is located at 1103 Walnut St, Hull, IA 51239 and is currently estimated at $171,950, approximately $117 per square foot. 1103 Walnut St is a home located in Sioux County with nearby schools including Boyden-Hull Elementary School, Boyden-Hull High School, and Hull Christian School.
Ownership History
Date
Name
Owned For
Owner Type
Purchase Details
Closed on
Nov 8, 2024
Sold by
United States Department Of Housing And and Secretary Of Housing And Urban Developme
Bought by
Devries Tessa K
Current Estimated Value
Purchase Details
Closed on
May 28, 2024
Sold by
Idaho Housing And Finance Association
Bought by
Secretary Of Housing And Urban Development
Purchase Details
Closed on
Mar 1, 2021
Sold by
Sandbulte Colin J and Sandbulte Amdison
Bought by
Buss Peter J
Home Financials for this Owner
Home Financials are based on the most recent Mortgage that was taken out on this home.
Original Mortgage
$135,500
Interest Rate
2.7%
Mortgage Type
FHA
Purchase Details
Closed on
Jun 30, 2017
Sold by
Maassen Michael J and Maassen Dawn M
Bought by
Sandbulte Colin J
Home Financials for this Owner
Home Financials are based on the most recent Mortgage that was taken out on this home.
Original Mortgage
$112,828
Interest Rate
3.94%
Mortgage Type
New Conventional
Purchase Details
Closed on
Jun 11, 2013
Sold by
Den Hartog Matthew E and Den Hartog Kellie R
Bought by
Maassen Michael J and Maassen Daen M
Home Financials for this Owner
Home Financials are based on the most recent Mortgage that was taken out on this home.
Original Mortgage
$87,755
Interest Rate
3.34%
Mortgage Type
New Conventional
Create a Home Valuation Report for This Property
The Home Valuation Report is an in-depth analysis detailing your home's value as well as a comparison with similar homes in the area
Home Values in the Area
Average Home Value in this Area
Purchase History
| Date | Buyer | Sale Price | Title Company |
|---|---|---|---|
| Devries Tessa K | -- | None Listed On Document | |
| Devries Tessa K | -- | None Listed On Document | |
| Secretary Of Housing And Urban Development | -- | None Listed On Document | |
| Secretary Of Housing And Urban Development | -- | None Listed On Document | |
| Buss Peter J | $138,000 | None Available | |
| Sandbulte Colin J | $109,000 | None Available | |
| Maassen Michael J | $86,000 | None Available |
Source: Public Records
Mortgage History
| Date | Status | Borrower | Loan Amount |
|---|---|---|---|
| Previous Owner | Buss Peter J | $135,500 | |
| Previous Owner | Sandbulte Colin J | $112,828 | |
| Previous Owner | Maassen Michael J | $87,755 |
Source: Public Records
Tax History Compared to Growth
Tax History
| Year | Tax Paid | Tax Assessment Tax Assessment Total Assessment is a certain percentage of the fair market value that is determined by local assessors to be the total taxable value of land and additions on the property. | Land | Improvement |
|---|---|---|---|---|
| 2025 | $2,254 | $179,290 | $10,860 | $168,430 |
| 2024 | $2,254 | $148,480 | $10,860 | $137,620 |
| 2023 | $2,066 | $148,480 | $10,860 | $137,620 |
| 2022 | $2,156 | $124,590 | $10,860 | $113,730 |
| 2021 | $1,794 | $124,830 | $10,860 | $113,970 |
| 2020 | $1,794 | $107,310 | $10,860 | $96,450 |
| 2019 | $1,610 | $96,060 | $4,530 | $91,530 |
| 2018 | $1,466 | $96,060 | $4,530 | $91,530 |
| 2017 | $1,466 | $86,750 | $4,530 | $82,220 |
| 2014 | $1,316 | $70,850 | $0 | $0 |
Source: Public Records
Map
Nearby Homes