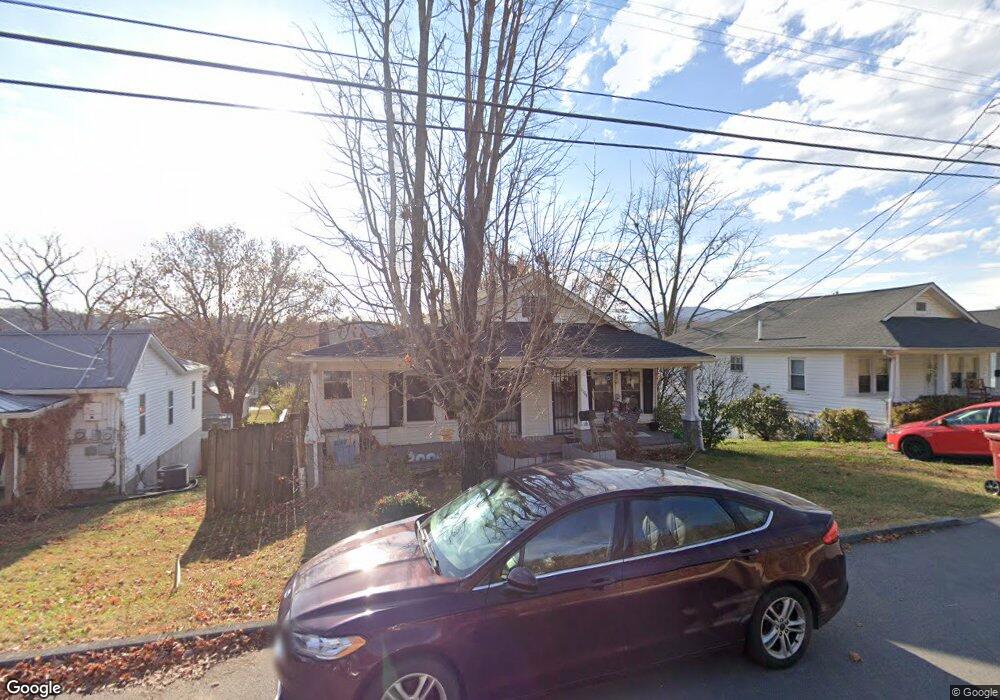
1104 E Market St Johnson City, TN 37601
Keystone NeighborhoodEstimated Value: $156,000 - $186,077
3
Beds
1
Bath
1,068
Sq Ft
$157/Sq Ft
Est. Value
About This Home
This home is located at 1104 E Market St, Johnson City, TN 37601 and is currently estimated at $167,519, approximately $156 per square foot. 1104 E Market St is a home located in Washington County with nearby schools including Mountain View Elementary School, Liberty Bell Middle School, and Indian Trail Middle School.
Ownership History
Date
Name
Owned For
Owner Type
Purchase Details
Closed on
Nov 23, 2022
Sold by
Foley Beverly Ann
Bought by
Foley Elizabeth A
Current Estimated Value
Purchase Details
Closed on
Feb 19, 2003
Sold by
Crumley Nancy
Bought by
Foley Elizabeth
Home Financials for this Owner
Home Financials are based on the most recent Mortgage that was taken out on this home.
Original Mortgage
$38,000
Interest Rate
6.5%
Purchase Details
Closed on
Aug 1, 2001
Sold by
Crumley Nancy
Bought by
Crumley Nancy
Create a Home Valuation Report for This Property
The Home Valuation Report is an in-depth analysis detailing your home's value as well as a comparison with similar homes in the area
Home Values in the Area
Average Home Value in this Area
Purchase History
| Date | Buyer | Sale Price | Title Company |
|---|---|---|---|
| Foley Elizabeth A | -- | -- | |
| Foley Elizabeth A | -- | None Listed On Document | |
| Foley Elizabeth | $47,500 | -- | |
| Crumley Nancy | -- | -- |
Source: Public Records
Mortgage History
| Date | Status | Borrower | Loan Amount |
|---|---|---|---|
| Previous Owner | Crumley Nancy | $38,000 | |
| Previous Owner | Crumley Nancy | $9,500 |
Source: Public Records
Tax History Compared to Growth
Tax History
| Year | Tax Paid | Tax Assessment Tax Assessment Total Assessment is a certain percentage of the fair market value that is determined by local assessors to be the total taxable value of land and additions on the property. | Land | Improvement |
|---|---|---|---|---|
| 2024 | $698 | $40,800 | $4,700 | $36,100 |
| 2023 | $354 | $16,475 | $0 | $0 |
| 2022 | $639 | $16,475 | $2,125 | $14,350 |
| 2021 | $639 | $16,475 | $2,125 | $14,350 |
| 2020 | $636 | $16,475 | $2,125 | $14,350 |
| 2019 | $349 | $16,475 | $2,125 | $14,350 |
| 2018 | $626 | $14,675 | $2,125 | $12,550 |
| 2017 | $626 | $14,675 | $2,125 | $12,550 |
| 2016 | $623 | $14,675 | $2,125 | $12,550 |
| 2015 | $565 | $14,675 | $2,125 | $12,550 |
| 2014 | $528 | $14,675 | $2,125 | $12,550 |
Source: Public Records
Map
Nearby Homes
- 1009 E Main St
- 505 Orleans St
- Tbd Orleans St
- 71 Glaze Farm Way
- 610 E Myrtle Ave
- 908 Afton St
- 900 Grover St
- 106 Water St
- 1003 1/2 E Watauga Ave
- 607 E Watauga Ave
- 1501 E Fairview Ave
- 1607 E Millard St
- 203 E Locust St
- 805 E Maple St
- 102 E Walnut St
- 1700 E Millard St
- 414 S Roan St Unit 202
- 1400 Stoneybrook Dr
- 1701 E Millard St
- 1704 Orlando Dr