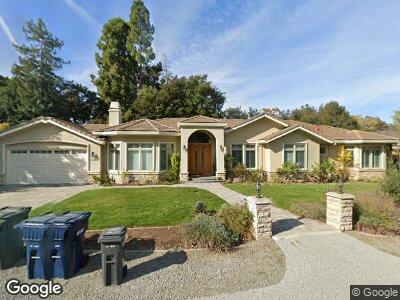
1104 Riverside Dr Los Altos, CA 94024
Estimated Value: $6,078,000 - $7,290,000
5
Beds
6
Baths
3,829
Sq Ft
$1,708/Sq Ft
Est. Value
About This Home
This home is located at 1104 Riverside Dr, Los Altos, CA 94024 and is currently estimated at $6,540,661, approximately $1,708 per square foot. 1104 Riverside Dr is a home located in Santa Clara County with nearby schools including Loyola Elementary School, Georgina P. Blach Junior High School, and Los Altos High School.
Ownership History
Date
Name
Owned For
Owner Type
Purchase Details
Closed on
Sep 5, 2003
Sold by
Kapatkar Anil and Joshi Girija
Bought by
Kapatkar Anil and Joshi Girija
Current Estimated Value
Purchase Details
Closed on
Aug 6, 2002
Sold by
Agam Isaac
Bought by
Kapatkar Anil and Joshi Girija
Home Financials for this Owner
Home Financials are based on the most recent Mortgage that was taken out on this home.
Original Mortgage
$1,500,000
Interest Rate
3.75%
Purchase Details
Closed on
Aug 8, 2000
Sold by
Cook Richard M
Bought by
Agam Isaac
Home Financials for this Owner
Home Financials are based on the most recent Mortgage that was taken out on this home.
Original Mortgage
$800,000
Interest Rate
8.15%
Create a Home Valuation Report for This Property
The Home Valuation Report is an in-depth analysis detailing your home's value as well as a comparison with similar homes in the area
Home Values in the Area
Average Home Value in this Area
Purchase History
| Date | Buyer | Sale Price | Title Company |
|---|---|---|---|
| Kapatkar Anil | -- | -- | |
| Kapatkar Anil | $2,500,000 | Stewart Title | |
| Agam Isaac | -- | Chicago Title Co |
Source: Public Records
Mortgage History
| Date | Status | Borrower | Loan Amount |
|---|---|---|---|
| Open | Kapatkar Anil | $837,000 | |
| Closed | Kapatkar Anil | $917,700 | |
| Closed | Kapatkar Anil | $958,500 | |
| Closed | Kapatkar Anil | $343,929 | |
| Closed | Kapatkar Anil | $1,022,200 | |
| Closed | Kapatkar Anil | $1,500,000 | |
| Closed | Kapatkar Anil | $1,500,000 | |
| Previous Owner | Agam Isaac | $430,000 | |
| Previous Owner | Agam Isaac | $1,477,503 | |
| Previous Owner | Agam Isaac | $800,000 |
Source: Public Records
Tax History Compared to Growth
Tax History
| Year | Tax Paid | Tax Assessment Tax Assessment Total Assessment is a certain percentage of the fair market value that is determined by local assessors to be the total taxable value of land and additions on the property. | Land | Improvement |
|---|---|---|---|---|
| 2024 | $42,115 | $3,549,841 | $1,703,924 | $1,845,917 |
| 2023 | $41,835 | $3,480,237 | $1,670,514 | $1,809,723 |
| 2022 | $41,423 | $3,411,998 | $1,637,759 | $1,774,239 |
| 2021 | $41,535 | $3,345,097 | $1,605,647 | $1,739,450 |
| 2020 | $41,601 | $3,310,799 | $1,589,184 | $1,721,615 |
| 2019 | $39,741 | $3,245,882 | $1,558,024 | $1,687,858 |
| 2018 | $39,212 | $3,182,238 | $1,527,475 | $1,654,763 |
| 2017 | $37,718 | $3,119,842 | $1,497,525 | $1,622,317 |
| 2016 | $36,901 | $3,058,669 | $1,468,162 | $1,590,507 |
| 2015 | $36,465 | $3,012,726 | $1,446,109 | $1,566,617 |
| 2014 | $36,024 | $2,953,712 | $1,417,782 | $1,535,930 |
Source: Public Records
Map
Nearby Homes
- 655 Berry Ave
- 1074 Riverside Dr
- 743 Edge Ln
- 504 Valley View Dr
- 867 Campbell Ave
- 24139 Summerhill Ave
- 24401 Summerhill Ave
- 674 Campbell Ave
- 1130 Runnymead Dr
- 1018 Loma Prieta Ct
- 530 Arboleda Dr
- 990 Rose Ave
- 1533 Topar Ave
- 955 Hayman Place
- 911 Matts Ct
- 1627 Shirley Ave
- 145 Fremont Ave
- 1632 Notre Dame Dr
- 364 Benvenue Ave
- 1670 Whitham Ave
- 1104 Riverside Dr
- 1086 Riverside Dr
- 1116 Riverside Dr
- 1099 Parma Way
- 1095 Riverside Dr
- 1117 Riverside Dr
- 1111 Parma Way
- 1081 Parma Way
- 1121 Parma Way
- 1112 Briarwood Ct
- 662 Oakwood Ct
- 1124 Briarwood Ct
- 1062 Riverside Dr
- 1106 Briarwood Ct
- 1129 Parma Way
- 1136 Briarwood Ct
- 1061 Parma Way
- 668 Oakwood Ct
- 654 Berry Ave
- 1098 Parma Way