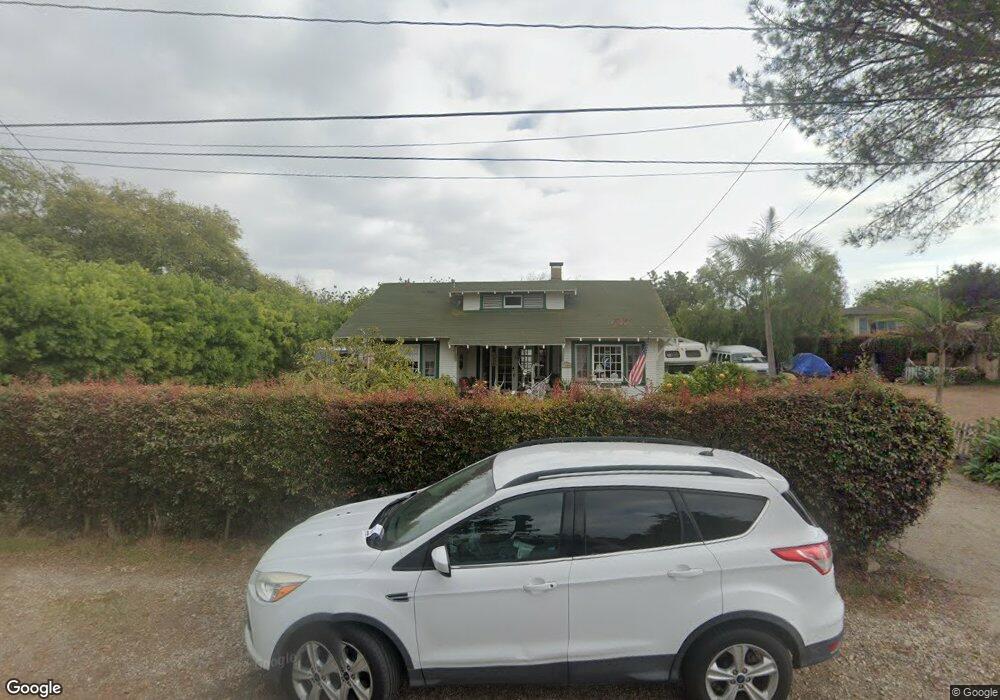
1104 Vallecito Rd Carpinteria, CA 93013
Old Town Carpinteria NeighborhoodEstimated Value: $1,132,000 - $2,091,683
Studio
--
Bath
--
Sq Ft
10,019
Sq Ft Lot
About This Home
This home is located at 1104 Vallecito Rd, Carpinteria, CA 93013 and is currently estimated at $1,713,921. 1104 Vallecito Rd is a home located in Santa Barbara County with nearby schools including Carpinteria Senior High School, The Howard School, and Cate School.
Ownership History
Date
Name
Owned For
Owner Type
Purchase Details
Closed on
Nov 17, 2009
Sold by
Kaklamanos Sharon
Bought by
Kaklamanos Sharon and Kaklamanos George
Current Estimated Value
Home Financials for this Owner
Home Financials are based on the most recent Mortgage that was taken out on this home.
Original Mortgage
$161,000
Interest Rate
4.99%
Mortgage Type
New Conventional
Purchase Details
Closed on
Feb 15, 2002
Sold by
Kaklamanos George T and Kaklamanos Sharon
Bought by
Kaklamanos Sharon
Home Financials for this Owner
Home Financials are based on the most recent Mortgage that was taken out on this home.
Original Mortgage
$200,650
Interest Rate
7.04%
Purchase Details
Closed on
Mar 26, 1997
Sold by
Gull David W
Bought by
Harris Sharon K
Create a Home Valuation Report for This Property
The Home Valuation Report is an in-depth analysis detailing your home's value as well as a comparison with similar homes in the area
Home Values in the Area
Average Home Value in this Area
Purchase History
| Date | Buyer | Sale Price | Title Company |
|---|---|---|---|
| Kaklamanos Sharon | -- | Old Republic Title Company | |
| Kaklamanos Sharon | -- | American Title Co | |
| Harris Sharon K | $19,500 | -- |
Source: Public Records
Mortgage History
| Date | Status | Borrower | Loan Amount |
|---|---|---|---|
| Closed | Kaklamanos Sharon | $161,000 | |
| Closed | Kaklamanos Sharon | $200,650 |
Source: Public Records
Tax History
| Year | Tax Paid | Tax Assessment Tax Assessment Total Assessment is a certain percentage of the fair market value that is determined by local assessors to be the total taxable value of land and additions on the property. | Land | Improvement |
|---|---|---|---|---|
| 2025 | $6,210 | $445,068 | $252,064 | $193,004 |
| 2023 | $6,210 | $427,787 | $242,277 | $185,510 |
| 2022 | $5,972 | $419,400 | $237,527 | $181,873 |
| 2021 | $5,818 | $411,177 | $232,870 | $178,307 |
| 2020 | $5,718 | $406,962 | $230,483 | $176,479 |
| 2019 | $5,579 | $398,983 | $225,964 | $173,019 |
| 2018 | $5,460 | $391,161 | $221,534 | $169,627 |
| 2017 | $5,337 | $383,492 | $217,191 | $166,301 |
| 2016 | $5,244 | $375,974 | $212,933 | $163,041 |
| 2015 | $5,198 | $370,327 | $209,735 | $160,592 |
| 2014 | $4,911 | $363,074 | $205,627 | $157,447 |
Source: Public Records
Map
Nearby Homes
- 5402 Cameo Rd
- 855 Walnut Ave
- 4869 Carpinteria Ave
- 5455 8th St Unit 58
- 5455 8th St Unit 95
- 5455 8th St Unit 5
- 635 Elm Ave Unit 1
- 1350 Tomol St
- 4725 9th St Unit 31
- 4677 Carpinteria Ave Unit P
- 5750 Via Real Unit 204
- 220 Elm Ave Unit 9
- 4980 Sandyland Rd
- 5700 Via Real Unit 106
- 5700 Via Real Unit 138
- 4731 4th St
- 4631 Carpinteria Ave
- 180 Holly Ave
- 349 Ash Ave Unit Spc 17
- 349 Ash Ave Unit 45
- 1110 Vallecito Rd
- 1070 Vallecito Rd
- 1114 Vallecito Rd
- 1050 Vallecito Rd
- 1120 Vallecito Rd
- 1126 Vallecito Rd
- 1069 Casitas Pass Rd
- 1053 Vallecito Rd
- 1127 Vallecito Rd
- 5310 Carpinteria Ave
- 5292 Carpinteria Ave
- 1132 Vallecito Rd
- 1133 Vallecito Rd
- 1116 Church Ln
- 5212-5214 Carpinteria Ave
- 5190 Carpinteria Ave
- 1134 Church Ln
- 5210 Carpinteria Ave
- 1141 Vallecito Rd
- 5320 Carpinteria Ave Unit E
Your Personal Tour Guide
Ask me questions while you tour the home.