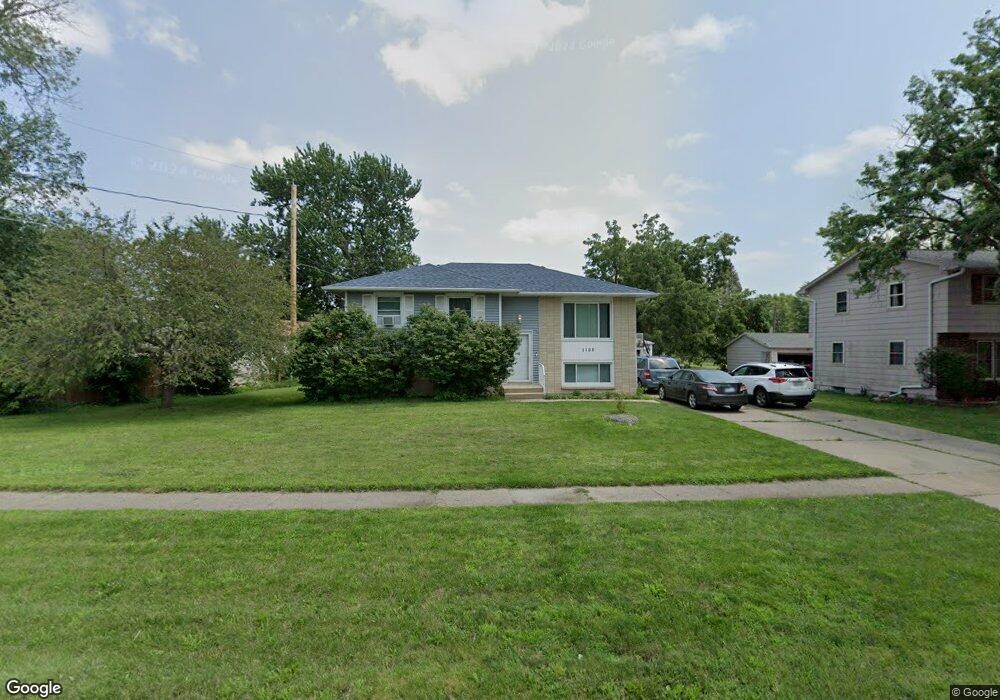
1105 3rd Ave SE Altoona, IA 50009
Estimated Value: $256,000 - $302,000
3
Beds
2
Baths
1,007
Sq Ft
$275/Sq Ft
Est. Value
About This Home
This home is located at 1105 3rd Ave SE, Altoona, IA 50009 and is currently estimated at $277,386, approximately $275 per square foot. 1105 3rd Ave SE is a home located in Polk County with nearby schools including Centennial Elementary School, Southeast Polk Spring Creek- 6th Grade, and Southeast Polk Junior High School.
Ownership History
Date
Name
Owned For
Owner Type
Purchase Details
Closed on
Feb 8, 2022
Sold by
Archer Jon D and Archer Sarah
Bought by
Perry Alex and Perry Amanda
Current Estimated Value
Home Financials for this Owner
Home Financials are based on the most recent Mortgage that was taken out on this home.
Original Mortgage
$225,834
Outstanding Balance
$209,330
Interest Rate
3.56%
Mortgage Type
FHA
Estimated Equity
$68,056
Purchase Details
Closed on
Aug 29, 2006
Sold by
Frew Heather L and Frew Aaron
Bought by
Archer Jon D and Archer Jason
Home Financials for this Owner
Home Financials are based on the most recent Mortgage that was taken out on this home.
Original Mortgage
$150,636
Interest Rate
6.77%
Mortgage Type
FHA
Purchase Details
Closed on
Mar 7, 2002
Sold by
Kois Darrel and Kois Debra
Bought by
Keeling Heather L
Home Financials for this Owner
Home Financials are based on the most recent Mortgage that was taken out on this home.
Original Mortgage
$115,192
Interest Rate
7.03%
Mortgage Type
FHA
Create a Home Valuation Report for This Property
The Home Valuation Report is an in-depth analysis detailing your home's value as well as a comparison with similar homes in the area
Home Values in the Area
Average Home Value in this Area
Purchase History
| Date | Buyer | Sale Price | Title Company |
|---|---|---|---|
| Perry Alex | $230,000 | None Listed On Document | |
| Archer Jon D | $152,500 | Itc | |
| Keeling Heather L | $116,500 | -- |
Source: Public Records
Mortgage History
| Date | Status | Borrower | Loan Amount |
|---|---|---|---|
| Open | Perry Alex | $225,834 | |
| Previous Owner | Archer Jon D | $150,636 | |
| Previous Owner | Keeling Heather L | $115,192 |
Source: Public Records
Tax History Compared to Growth
Tax History
| Year | Tax Paid | Tax Assessment Tax Assessment Total Assessment is a certain percentage of the fair market value that is determined by local assessors to be the total taxable value of land and additions on the property. | Land | Improvement |
|---|---|---|---|---|
| 2025 | $4,060 | $265,300 | $58,900 | $206,400 |
| 2024 | $4,060 | $246,100 | $53,900 | $192,200 |
| 2023 | $3,874 | $246,100 | $53,900 | $192,200 |
| 2022 | $4,010 | $198,700 | $45,100 | $153,600 |
| 2021 | $3,876 | $199,000 | $45,100 | $153,900 |
| 2020 | $3,814 | $183,100 | $41,400 | $141,700 |
| 2019 | $3,456 | $183,100 | $41,400 | $141,700 |
| 2018 | $3,462 | $162,900 | $36,000 | $126,900 |
| 2017 | $3,558 | $162,900 | $36,000 | $126,900 |
| 2016 | $3,550 | $151,700 | $33,700 | $118,000 |
| 2015 | $3,550 | $151,700 | $33,700 | $118,000 |
| 2014 | $3,632 | $153,600 | $33,700 | $119,900 |
Source: Public Records
Map
Nearby Homes
- 1206 3rd Ave SE
- 103 12th St SE
- 3424 5th Ave SE
- 3423 5th Ave SE
- 3406 5th Ave SE
- 3412 5th Ave SE
- 1411 4th Ave SE
- 1309 6th Ave SE
- 4016 2nd Ave SW
- 4009 2nd Ave SW
- 4015 2nd Ave SW
- 907 7th Ave SE Unit 1
- 725 11th St SE
- 708 2nd Ave SW
- 909 7th Ave SE Unit 6
- 603 1st Ave S
- 526 Sunset Dr SE
- 1308 9th Avenue Place SE
- 707 18th St SE
- 522 Kelsey Ln
- 1201 3rd Ave SE
- 302 11th St SE
- 300 11th St SE
- 1203 3rd Ave SE
- 306 11th St SE
- 1704 11th St SE
- 1623 11th St SE
- 1615 11th St SE
- 1205 3rd Ave SE
- 115 12th St SE
- 118 12th St SE
- 116 11th St SE
- 308 11th St SE
- 303 11th St SE
- 1207 3rd Ave SE
- 1007 3rd Ave SE
- 1204 3rd Ave SE
- 305 11th St SE
- 1106 4th Ave SE
- 1200 4th Ave SE