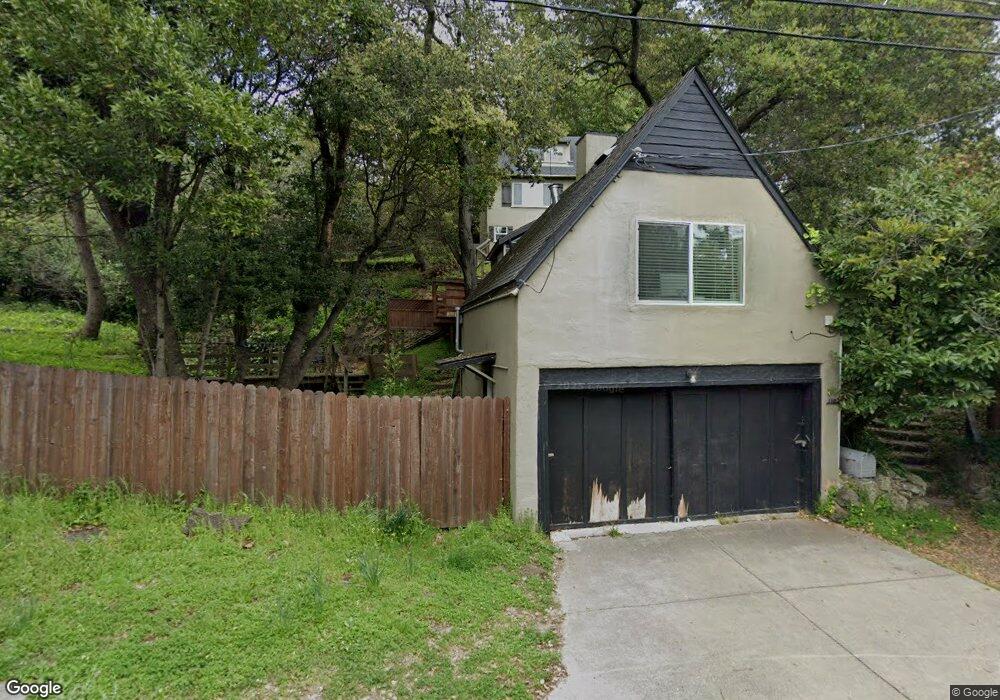
1105 Keith Ave Berkeley, CA 94708
Berkeley Hills NeighborhoodEstimated Value: $1,104,145 - $1,767,000
2
Beds
1
Bath
1,064
Sq Ft
$1,320/Sq Ft
Est. Value
About This Home
This home is located at 1105 Keith Ave, Berkeley, CA 94708 and is currently estimated at $1,404,786, approximately $1,320 per square foot. 1105 Keith Ave is a home located in Alameda County with nearby schools including Cragmont Elementary School, Berkeley Arts Magnet at Whittier School, and Washington Elementary School.
Ownership History
Date
Name
Owned For
Owner Type
Purchase Details
Closed on
Aug 14, 2024
Sold by
Saroja Family Trust and Kareti Aparna
Bought by
Natber 11 Statutory Trust and Vinsai Llc
Current Estimated Value
Purchase Details
Closed on
Feb 5, 2016
Sold by
Imt Associates
Bought by
Kareti Aparna and The Saroja Family Trust
Purchase Details
Closed on
Aug 7, 2010
Sold by
Wilbourn Robert S and John R Stallings Jr Living Tru
Bought by
Imt Associates and Marjorjie Muchahy Special Needs Trust
Purchase Details
Closed on
Jul 5, 2008
Sold by
Stallings John R and John R Stallings Jr Living Tru
Bought by
Wilbourn Robert S and John R Stallings Jr Living Tru
Purchase Details
Closed on
Jul 9, 2004
Sold by
Stallings John R and Stallings John Robert
Bought by
Stallings John R and John R Stallings Jr Living Tru
Create a Home Valuation Report for This Property
The Home Valuation Report is an in-depth analysis detailing your home's value as well as a comparison with similar homes in the area
Home Values in the Area
Average Home Value in this Area
Purchase History
| Date | Buyer | Sale Price | Title Company |
|---|---|---|---|
| Natber 11 Statutory Trust | -- | None Listed On Document | |
| Kareti Aparna | $750,000 | Old Republic Title Company | |
| Imt Associates | -- | None Available | |
| Wilbourn Robert S | -- | None Available | |
| Stallings John R | -- | -- |
Source: Public Records
Tax History
| Year | Tax Paid | Tax Assessment Tax Assessment Total Assessment is a certain percentage of the fair market value that is determined by local assessors to be the total taxable value of land and additions on the property. | Land | Improvement |
|---|---|---|---|---|
| 2025 | $14,030 | $887,827 | $591,885 | $295,942 |
| 2024 | $14,030 | $870,420 | $580,280 | $290,140 |
| 2023 | $13,721 | $853,357 | $568,905 | $284,452 |
| 2022 | $13,458 | $836,625 | $557,750 | $278,875 |
| 2021 | $13,478 | $820,222 | $546,815 | $273,407 |
| 2020 | $12,767 | $811,815 | $541,210 | $270,605 |
| 2019 | $12,286 | $795,900 | $530,600 | $265,300 |
| 2018 | $12,071 | $780,300 | $520,200 | $260,100 |
| 2017 | $11,641 | $765,000 | $510,000 | $255,000 |
| 2016 | $4,003 | $152,616 | $127,637 | $24,979 |
| 2015 | $3,928 | $150,324 | $125,720 | $24,604 |
| 2014 | $3,634 | $147,380 | $123,258 | $24,122 |
Source: Public Records
Map
Nearby Homes
- 1106 Cragmont Ave
- 1165 Cragmont Ave
- 962 Regal Rd
- 1155 Keeler Ave
- 1110 Sterling Ave
- 1004 Cragmont Ave
- 1024 Grizzly Peak Blvd
- 1085 Creston Rd
- 1160 Miller Ave
- 2315 Eunice St
- 2686 Shasta Rd
- 938 San Benito Rd
- 935 Grizzly Peak Blvd
- 2501 Rose Walk
- 2121 Eunice St
- 1221 Grizzly Peak Blvd
- 777 Cragmont Ave
- 1375 Queens Rd
- 758 Spruce St
- 730 Wildcat Canyon Rd
- 22 Bret Harte Rd
- 32 Bret Harte Rd
- 21 Bret Harte Rd
- 1104 Keith Ave
- 1100 Keith Ave
- 1110 Cragmont Ave
- 1098 Keith Ave
- 1106 Keith Ave
- 1115 Keith Ave
- 42 Bret Harte Rd
- 1096 Keith Ave
- 31 Bret Harte Rd
- 1110 Keith Ave
- 1094 Keith Ave
- 47 Bret Harte Rd
- 1093 Euclid Ave
- 1117 Keith Ave
- 1099 Euclid Ave
- 1087 Euclid Ave
- 51 Bret Harte Rd
Your Personal Tour Guide
Ask me questions while you tour the home.