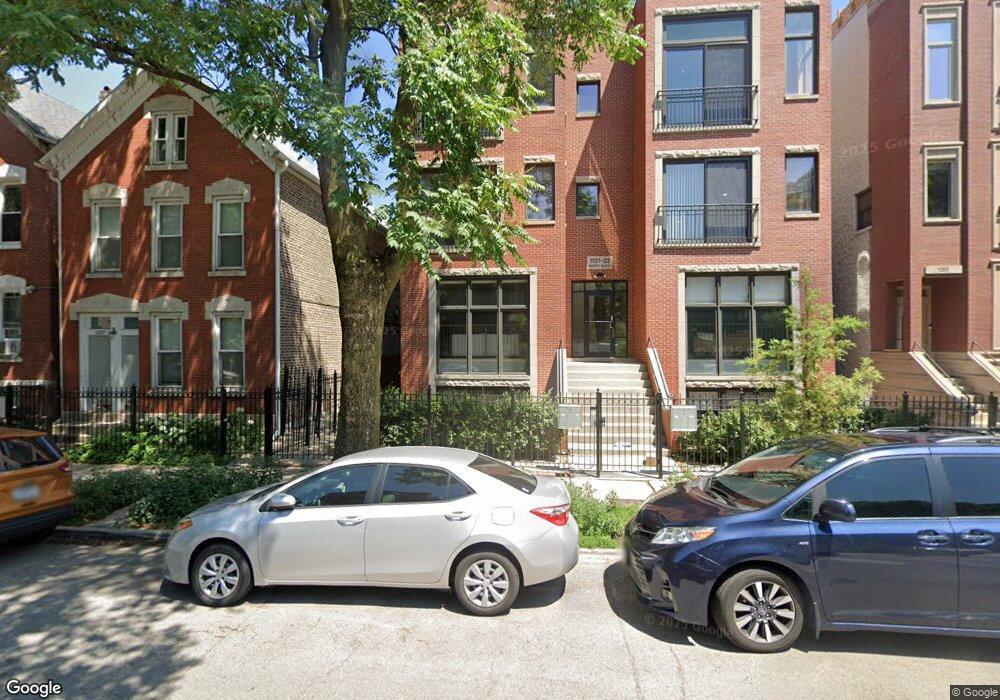
1105 N Wood St Unit 1103-1 Chicago, IL 60622
East Village NeighborhoodEstimated Value: $725,000 - $935,000
3
Beds
3
Baths
2,000
Sq Ft
$407/Sq Ft
Est. Value
About This Home
This home is located at 1105 N Wood St Unit 1103-1, Chicago, IL 60622 and is currently estimated at $813,883, approximately $406 per square foot. 1105 N Wood St Unit 1103-1 is a home located in Cook County with nearby schools including A.N. Pritzker School, Wells Community Academy High School, and Holy Trinity High School.
Ownership History
Date
Name
Owned For
Owner Type
Purchase Details
Closed on
Aug 19, 2021
Sold by
Dormeier Joshua Logan and Glaeser Megan Elise
Bought by
Dormeier Joshua Logan and Glaeser Megan Elise
Current Estimated Value
Home Financials for this Owner
Home Financials are based on the most recent Mortgage that was taken out on this home.
Original Mortgage
$491,250
Outstanding Balance
$445,345
Interest Rate
2.7%
Mortgage Type
New Conventional
Estimated Equity
$368,538
Purchase Details
Closed on
May 14, 2020
Sold by
Larsen Paul and Larsen Danielle
Bought by
Dormeier Joshua Logan
Home Financials for this Owner
Home Financials are based on the most recent Mortgage that was taken out on this home.
Original Mortgage
$510,400
Interest Rate
3.1%
Mortgage Type
New Conventional
Purchase Details
Closed on
Mar 31, 2016
Sold by
Petrezelka James R
Bought by
Larsen Paul and Larsen Danielle
Create a Home Valuation Report for This Property
The Home Valuation Report is an in-depth analysis detailing your home's value as well as a comparison with similar homes in the area
Home Values in the Area
Average Home Value in this Area
Purchase History
| Date | Buyer | Sale Price | Title Company |
|---|---|---|---|
| Dormeier Joshua Logan | -- | Attorney | |
| Dormeier Joshua Logan | $575,000 | Chicago Title Insurance Co | |
| Larsen Paul | $540,000 | None Available |
Source: Public Records
Mortgage History
| Date | Status | Borrower | Loan Amount |
|---|---|---|---|
| Open | Dormeier Joshua Logan | $491,250 | |
| Previous Owner | Dormeier Joshua Logan | $510,400 |
Source: Public Records
Tax History Compared to Growth
Tax History
| Year | Tax Paid | Tax Assessment Tax Assessment Total Assessment is a certain percentage of the fair market value that is determined by local assessors to be the total taxable value of land and additions on the property. | Land | Improvement |
|---|---|---|---|---|
| 2024 | $15,052 | $86,417 | $13,432 | $72,985 |
| 2023 | $14,608 | $74,441 | $5,249 | $69,192 |
| 2022 | $14,608 | $74,441 | $5,249 | $69,192 |
| 2021 | $14,300 | $74,441 | $5,249 | $69,192 |
| 2020 | $10,383 | $49,710 | $5,249 | $44,461 |
| 2019 | $10,224 | $54,317 | $5,249 | $49,068 |
| 2018 | $10,051 | $54,317 | $5,249 | $49,068 |
| 2017 | $10,861 | $53,830 | $4,631 | $49,199 |
| 2016 | $13,256 | $68,680 | $4,631 | $64,049 |
| 2015 | $12,105 | $68,680 | $4,631 | $64,049 |
| 2014 | $9,543 | $54,001 | $3,937 | $50,064 |
| 2013 | $9,343 | $54,001 | $3,937 | $50,064 |
Source: Public Records
Map
Nearby Homes
- 1035 N Hermitage Ave Unit 3
- 1824 W Haddon Ave
- 1012 N Wood St Unit 2
- 1036 N Honore St
- 1015 N Hermitage Ave Unit C
- 1015 N Hermitage Ave Unit A
- 1850 W Thomas St
- 1002 N Wood St
- 1018 N Honore St Unit C
- 1103 N Paulina St Unit 2
- 1744 W Division St Unit 2
- 1019 N Wolcott Ave
- 1056 N Marshfield Ave Unit 1
- 1108 N Wolcott Ave
- 1032 N Marshfield Ave Unit 1R
- 2405 W Iowa St Unit 405
- 1648 W Augusta Blvd Unit 3E
- 1222 N Paulina St
- 1039 N Marshfield Ave Unit 2
- 1041 N Winchester Ave Unit 2
- 1105 N Wood St Unit 1103-3
- 1101 N Wood St Unit 11011
- 1101 N Wood St Unit 11012
- 1101 N Wood St Unit 11013
- 1101 N Wood St Unit 3
- 1103 N Wood St Unit 11032
- 1103 N Wood St Unit 3N
- 1103 N Wood St Unit 1N
- 1107 N Wood St Unit 1
- 1107 N Wood St
- 1065 N Wood St Unit 1
- 1065 N Wood St Unit 3
- 1065 N Wood St Unit 2
- 1111 N Wood St
- 1063 N Wood St
- 1063 N Wood St Unit 2
- 1059 N Wood St
- 1113 N Wood St Unit 2
- 1113 N Wood St Unit 3
- 1113 N Wood St Unit 2