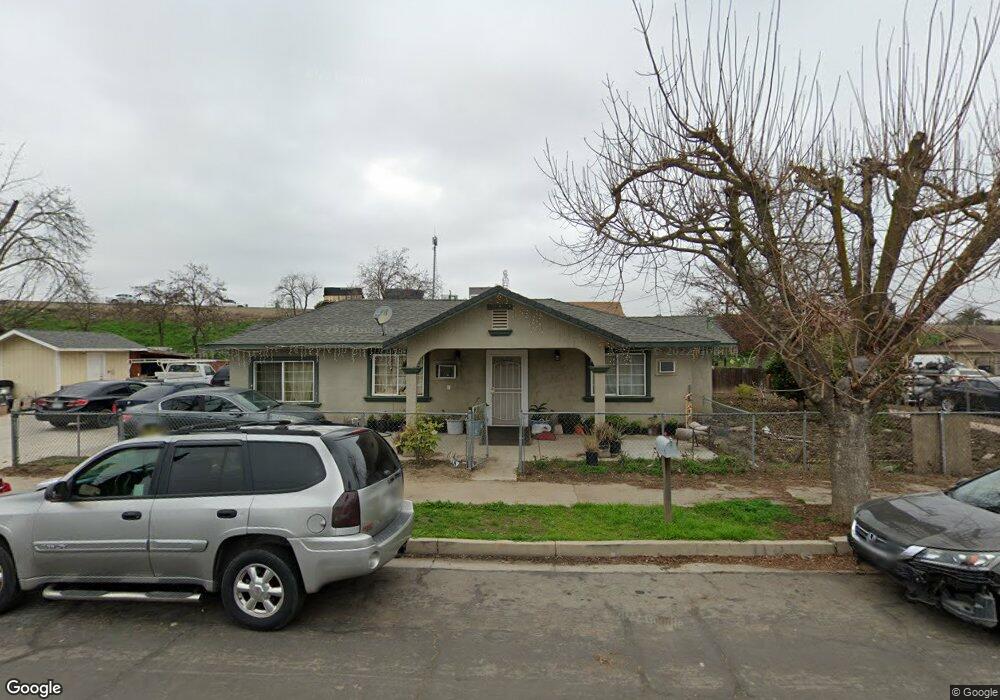
1105 W Sonora St Stockton, CA 95203
Seaport NeighborhoodEstimated Value: $224,000 - $301,000
2
Beds
1
Bath
1,076
Sq Ft
$247/Sq Ft
Est. Value
About This Home
This home is located at 1105 W Sonora St, Stockton, CA 95203 and is currently estimated at $265,391, approximately $246 per square foot. 1105 W Sonora St is a home located in San Joaquin County with nearby schools including George Washington Elementary School, San Joaquin Elementary School, and John Marshall Elementary School.
Ownership History
Date
Name
Owned For
Owner Type
Purchase Details
Closed on
Jun 28, 2000
Sold by
Rodriguez Nieves
Bought by
Rodriguez Jose Luis
Current Estimated Value
Home Financials for this Owner
Home Financials are based on the most recent Mortgage that was taken out on this home.
Original Mortgage
$74,023
Outstanding Balance
$27,238
Interest Rate
8.63%
Mortgage Type
FHA
Estimated Equity
$238,153
Purchase Details
Closed on
May 19, 2000
Sold by
Beneficial Finance Inc
Bought by
Kemp Howard and Kemp Raylene
Home Financials for this Owner
Home Financials are based on the most recent Mortgage that was taken out on this home.
Original Mortgage
$74,023
Outstanding Balance
$27,238
Interest Rate
8.63%
Mortgage Type
FHA
Estimated Equity
$238,153
Purchase Details
Closed on
Nov 17, 1999
Sold by
Wise Debra F
Bought by
Beneficial California Inc
Create a Home Valuation Report for This Property
The Home Valuation Report is an in-depth analysis detailing your home's value as well as a comparison with similar homes in the area
Home Values in the Area
Average Home Value in this Area
Purchase History
| Date | Buyer | Sale Price | Title Company |
|---|---|---|---|
| Rodriguez Jose Luis | -- | Fidelity National Title Co | |
| Rodriguez Jose Luis | $75,000 | Fidelity National Title Co | |
| Kemp Howard | $39,000 | Fidelity National Title Co | |
| Beneficial California Inc | $28,385 | American Title |
Source: Public Records
Mortgage History
| Date | Status | Borrower | Loan Amount |
|---|---|---|---|
| Open | Rodriguez Jose Luis | $74,023 | |
| Closed | Rodriguez Jose Luis | $4,500 |
Source: Public Records
Tax History Compared to Growth
Tax History
| Year | Tax Paid | Tax Assessment Tax Assessment Total Assessment is a certain percentage of the fair market value that is determined by local assessors to be the total taxable value of land and additions on the property. | Land | Improvement |
|---|---|---|---|---|
| 2025 | $1,626 | $118,306 | $30,131 | $88,175 |
| 2024 | $1,599 | $115,988 | $29,541 | $86,447 |
| 2023 | $1,562 | $113,714 | $28,962 | $84,752 |
| 2022 | $1,408 | $111,486 | $28,395 | $83,091 |
| 2021 | $1,354 | $109,301 | $27,839 | $81,462 |
| 2020 | $1,379 | $108,181 | $27,554 | $80,627 |
| 2019 | $1,374 | $106,061 | $27,014 | $79,047 |
| 2018 | $1,349 | $103,983 | $26,485 | $77,498 |
| 2017 | $1,278 | $101,945 | $25,966 | $75,979 |
| 2016 | $1,301 | $99,947 | $25,457 | $74,490 |
| 2014 | $1,020 | $79,000 | $24,000 | $55,000 |
Source: Public Records
Map
Nearby Homes
- 510- S Pershing Ave
- 1661 W Hazelton Ave
- 519 W Scotts Ave
- 1765 W Sonora St
- 348 S Los Angeles Ave
- 309 S Los Angeles Ave
- 20 S Los Angeles Ave
- 520 W Jackson St
- 416 W Jackson St
- 525 W Fremont St
- 727 N Stockton St
- 715 W Park St
- 720 W Flora St
- 826 N San Jose St
- 519 N Monroe St
- 319 W Oak St
- 522-528 N Van Buren St
- 840 N Edison St
- 907 N Pershing Ave
- 1004 N Stockton St
- 1127 W Sonora St
- 343 S Argonaut St
- 1126 W Sonora St
- 405 S Argonaut St
- 1112 W Sonora St
- 352 S Orange St
- 352 S Argonaut St
- 1140 W Sonora St
- 342 S Argonaut St
- 1054 W Sonora St
- 406 S Orange St
- 338 S Argonaut St
- 401 S Orange St
- 1034 W Sonora St
- 420 S Argonaut St
- 1014 W Sonora St
- 341 S San Jose St
- 337 S San Jose St
- 405 S Orange St
- 333 S San Jose St