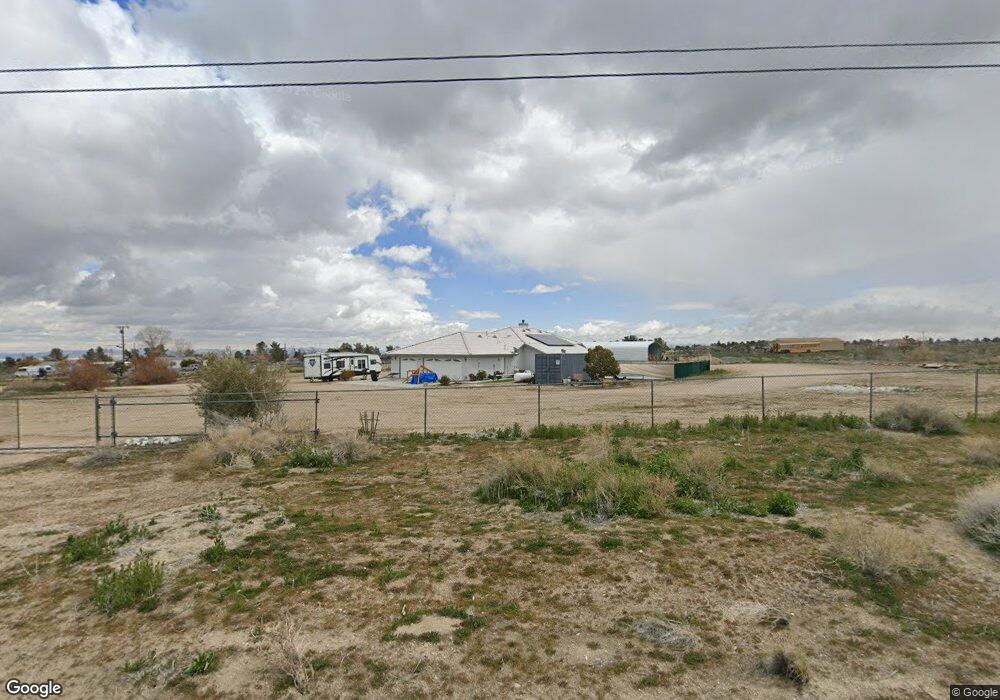
11051 Riggins Rd Phelan, CA 92371
Estimated Value: $481,000 - $563,000
3
Beds
3
Baths
2,202
Sq Ft
$237/Sq Ft
Est. Value
About This Home
This home is located at 11051 Riggins Rd, Phelan, CA 92371 and is currently estimated at $522,003, approximately $237 per square foot. 11051 Riggins Rd is a home located in San Bernardino County with nearby schools including Phelan Elementary School, Pinon Mesa Middle School, and Serrano High School.
Ownership History
Date
Name
Owned For
Owner Type
Purchase Details
Closed on
Mar 24, 2020
Sold by
Dennis Michael J and Dennis Gena Leann
Bought by
Dennis Gena Leann and Dennis Michael J
Current Estimated Value
Home Financials for this Owner
Home Financials are based on the most recent Mortgage that was taken out on this home.
Original Mortgage
$180,000
Outstanding Balance
$124,352
Interest Rate
3.4%
Mortgage Type
New Conventional
Estimated Equity
$397,651
Purchase Details
Closed on
Jun 23, 2014
Sold by
Dennis Michael J and Dennis Gena Leann
Bought by
Dennis Michael J and Dennis Gena Leann
Home Financials for this Owner
Home Financials are based on the most recent Mortgage that was taken out on this home.
Original Mortgage
$167,075
Interest Rate
4.09%
Mortgage Type
New Conventional
Purchase Details
Closed on
Feb 18, 2009
Sold by
Aurora Loan Services Llc
Bought by
Dennis Michael J and Powers Gena L
Home Financials for this Owner
Home Financials are based on the most recent Mortgage that was taken out on this home.
Original Mortgage
$181,894
Interest Rate
5.15%
Mortgage Type
FHA
Purchase Details
Closed on
Jan 20, 2009
Sold by
Kang Young Il
Bought by
Aurora Loan Services Llc
Home Financials for this Owner
Home Financials are based on the most recent Mortgage that was taken out on this home.
Original Mortgage
$181,894
Interest Rate
5.15%
Mortgage Type
FHA
Purchase Details
Closed on
Jul 19, 2006
Sold by
Kim Hye Ran
Bought by
Kang Young
Home Financials for this Owner
Home Financials are based on the most recent Mortgage that was taken out on this home.
Original Mortgage
$54,000
Interest Rate
6.57%
Mortgage Type
Credit Line Revolving
Purchase Details
Closed on
Dec 6, 2005
Sold by
Gonchar Mark J
Bought by
Kim Hye Ran
Home Financials for this Owner
Home Financials are based on the most recent Mortgage that was taken out on this home.
Original Mortgage
$412,000
Interest Rate
1.62%
Mortgage Type
Fannie Mae Freddie Mac
Purchase Details
Closed on
Jan 10, 2003
Sold by
Oparnica Linda R
Bought by
Gonchar Mark J
Purchase Details
Closed on
Nov 6, 2002
Sold by
Sera Thomas and The Thomas Sera Declaration Of
Bought by
Gonchar Mark J
Home Financials for this Owner
Home Financials are based on the most recent Mortgage that was taken out on this home.
Original Mortgage
$184,000
Interest Rate
6.15%
Mortgage Type
Construction
Create a Home Valuation Report for This Property
The Home Valuation Report is an in-depth analysis detailing your home's value as well as a comparison with similar homes in the area
Home Values in the Area
Average Home Value in this Area
Purchase History
| Date | Buyer | Sale Price | Title Company |
|---|---|---|---|
| Dennis Gena Leann | -- | Stewart Title Of Califorina | |
| Dennis Michael J | -- | Spl Title Services | |
| Dennis Michael J | $185,500 | Old Republic Title Company | |
| Aurora Loan Services Llc | $222,200 | None Available | |
| Kang Young | $540,000 | Chicago Title Company | |
| Kim Hye Ran | $525,000 | Lawyers Title Company | |
| Gonchar Mark J | -- | Chicago Title Co | |
| Gonchar Mark J | $23,000 | Chicago Title Co |
Source: Public Records
Mortgage History
| Date | Status | Borrower | Loan Amount |
|---|---|---|---|
| Open | Dennis Gena Leann | $180,000 | |
| Closed | Dennis Michael J | $167,075 | |
| Closed | Dennis Michael J | $181,894 | |
| Previous Owner | Kang Young | $54,000 | |
| Previous Owner | Kang Young | $432,000 | |
| Previous Owner | Kim Hye Ran | $412,000 | |
| Previous Owner | Gonchar Mark J | $184,000 |
Source: Public Records
Tax History Compared to Growth
Tax History
| Year | Tax Paid | Tax Assessment Tax Assessment Total Assessment is a certain percentage of the fair market value that is determined by local assessors to be the total taxable value of land and additions on the property. | Land | Improvement |
|---|---|---|---|---|
| 2025 | $2,873 | $238,558 | $90,143 | $148,415 |
| 2024 | $2,873 | $233,880 | $88,375 | $145,505 |
| 2023 | $2,838 | $229,294 | $86,642 | $142,652 |
| 2022 | $2,773 | $224,798 | $84,943 | $139,855 |
| 2021 | $2,722 | $220,390 | $83,277 | $137,113 |
| 2020 | $2,687 | $218,130 | $82,423 | $135,707 |
| 2019 | $2,636 | $213,853 | $80,807 | $133,046 |
| 2018 | $2,432 | $209,660 | $79,223 | $130,437 |
| 2017 | $2,389 | $205,549 | $77,670 | $127,879 |
| 2016 | $2,339 | $201,519 | $76,147 | $125,372 |
| 2015 | $2,310 | $198,492 | $75,003 | $123,489 |
| 2014 | $2,274 | $194,604 | $73,534 | $121,070 |
Source: Public Records
Map
Nearby Homes
- 4280 Solano Rd
- 11221 Valle Vista Rd
- 10922 Sheep Creek Rd
- 4176 Goss Rd
- 0 Valle Vista Rd Unit HD25097384
- 0 Valle Vista Rd Unit HD22036396
- 0 Rancho Rd Unit SW23138713
- 4232 Coyote Rd
- 9779 Clovis Rd
- 11213 Monte Vista Rd
- 10666 Monte Vista Rd
- 0 Mono Rd Unit PW25230494
- 0 Mono Rd Unit HD25199974
- 0 Mono Rd Unit HD25199982
- 9268 Sierra Vista Rd
- 11111 Johnson Rd
- 14778 Johnson Rd
- 3731 Goss Rd
- 0 Daisy Ln Unit HD25118589
- 1 Daisy Ln
- 12671 Riggins Rd
- 4379 Solano Rd
- 4334 Solano Rd
- 4370 Solano Rd
- 10966 Riggins Rd
- 4329 Amador Rd
- 10970 Riggins Rd
- 4277 Amador Rd
- 4224 Solano Rd
- 4445 Amador Rd
- 4266 Amador Rd
- 11010 Valle Vista Rd
- 10921 Riggins Rd
- 4388 Amador Rd
- 10924 Riggins Rd
- 4171 Amador Rd
- 4220 Amador Rd
- 11088 Valle Vista Rd
- 11077 Valle Vista Rd
- 10881 Riggins Rd