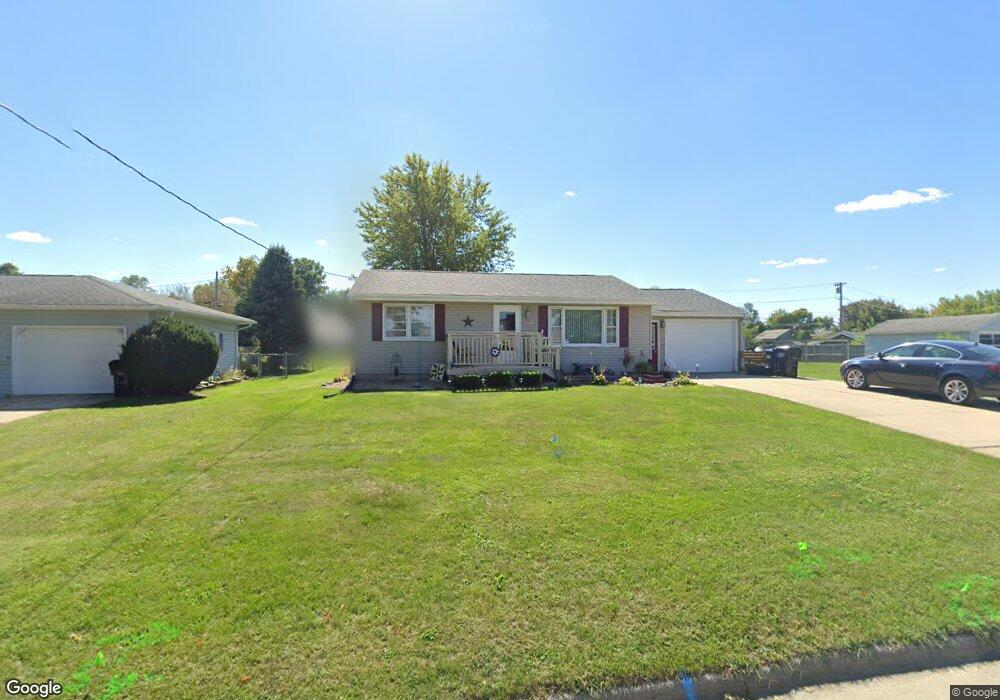
1106 E 3rd St Vinton, IA 52349
Estimated Value: $160,000 - $193,000
2
Beds
3
Baths
936
Sq Ft
$190/Sq Ft
Est. Value
About This Home
This home is located at 1106 E 3rd St, Vinton, IA 52349 and is currently estimated at $177,725, approximately $189 per square foot. 1106 E 3rd St is a home located in Benton County with nearby schools including Tilford Elementary School, Vinton-Shellsburg Middle School, and Vinton-Shellsburg High School.
Ownership History
Date
Name
Owned For
Owner Type
Purchase Details
Closed on
Nov 20, 2009
Sold by
Narber Gail L and Narber Tammy D
Bought by
Peacock James P and Peacock Bonnie J
Current Estimated Value
Home Financials for this Owner
Home Financials are based on the most recent Mortgage that was taken out on this home.
Original Mortgage
$87,875
Interest Rate
4.9%
Mortgage Type
New Conventional
Purchase Details
Closed on
Jun 30, 2005
Sold by
Doud Shirley A
Bought by
Narber Gail L and Narber Tammy D
Home Financials for this Owner
Home Financials are based on the most recent Mortgage that was taken out on this home.
Original Mortgage
$112,005
Interest Rate
5.75%
Mortgage Type
New Conventional
Create a Home Valuation Report for This Property
The Home Valuation Report is an in-depth analysis detailing your home's value as well as a comparison with similar homes in the area
Home Values in the Area
Average Home Value in this Area
Purchase History
| Date | Buyer | Sale Price | Title Company |
|---|---|---|---|
| Peacock James P | $92,500 | None Available | |
| Narber Gail L | $118,000 | None Available |
Source: Public Records
Mortgage History
| Date | Status | Borrower | Loan Amount |
|---|---|---|---|
| Previous Owner | Peacock James P | $87,875 | |
| Previous Owner | Narber Gail L | $112,005 |
Source: Public Records
Tax History
| Year | Tax Paid | Tax Assessment Tax Assessment Total Assessment is a certain percentage of the fair market value that is determined by local assessors to be the total taxable value of land and additions on the property. | Land | Improvement |
|---|---|---|---|---|
| 2025 | $2,232 | $158,500 | $20,500 | $138,000 |
| 2024 | $2,232 | $143,000 | $20,100 | $122,900 |
| 2023 | $2,300 | $143,000 | $20,100 | $122,900 |
| 2022 | $2,360 | $115,800 | $16,100 | $99,700 |
| 2021 | $2,360 | $115,800 | $16,100 | $99,700 |
| 2020 | $2,076 | $104,700 | $13,200 | $91,500 |
| 2019 | $2,068 | $104,700 | $13,200 | $91,500 |
| 2018 | $2,006 | $102,900 | $12,500 | $90,400 |
| 2017 | $1,924 | $102,900 | $12,500 | $90,400 |
| 2016 | $1,888 | $96,200 | $11,700 | $84,500 |
| 2015 | $1,888 | $96,200 | $11,700 | $84,500 |
| 2014 | $1,952 | $99,000 | $0 | $0 |
Source: Public Records
Map
Nearby Homes
Your Personal Tour Guide
Ask me questions while you tour the home.