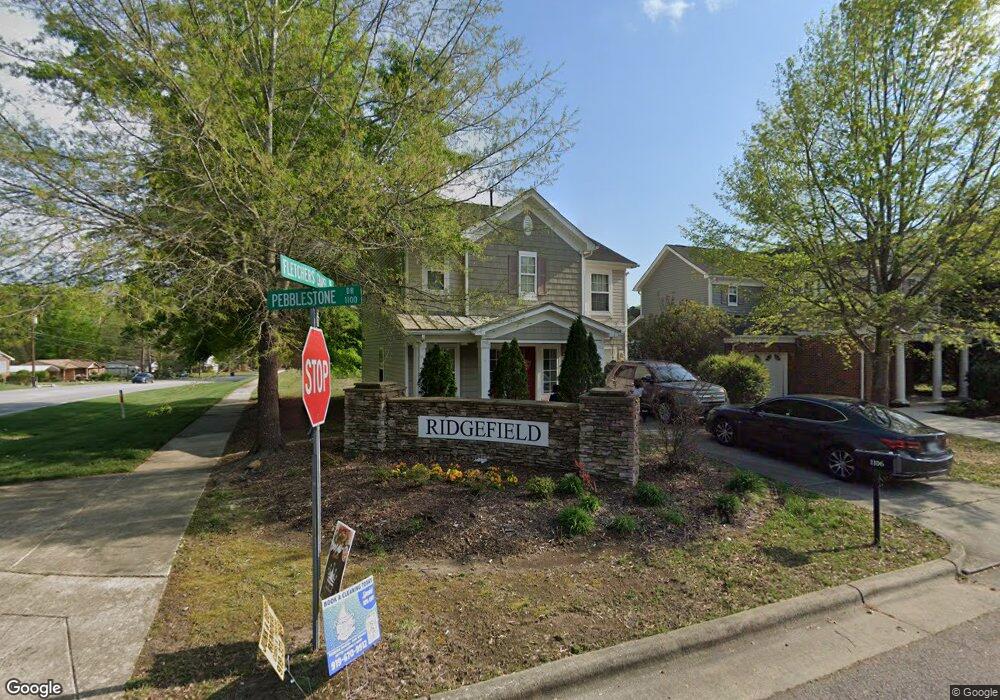
1106 Pebblestone Dr Durham, NC 27703
Eastern Durham NeighborhoodEstimated Value: $301,182 - $329,000
3
Beds
3
Baths
1,453
Sq Ft
$217/Sq Ft
Est. Value
About This Home
This home is located at 1106 Pebblestone Dr, Durham, NC 27703 and is currently estimated at $315,546, approximately $217 per square foot. 1106 Pebblestone Dr is a home located in Durham County with nearby schools including Glenn Elementary, John W Neal Middle School, and Southern School of Energy & Sustainability.
Ownership History
Date
Name
Owned For
Owner Type
Purchase Details
Closed on
Jun 29, 2021
Sold by
Wootton Lance A
Bought by
Grandview Rentals Llc
Current Estimated Value
Purchase Details
Closed on
Dec 31, 2013
Sold by
Wootton Lance A and Wootton Virginia M
Bought by
Wootton Lance A and Wootton Virginia M
Purchase Details
Closed on
Sep 16, 2013
Sold by
Bradley Rhonda and The Bank Of New York Mellon
Bought by
Wootton Lance
Purchase Details
Closed on
Aug 31, 2006
Sold by
Kb Home Raleigh Durham Llc
Bought by
Bradley Rhonda C
Home Financials for this Owner
Home Financials are based on the most recent Mortgage that was taken out on this home.
Original Mortgage
$29,390
Interest Rate
6.58%
Mortgage Type
Stand Alone Second
Create a Home Valuation Report for This Property
The Home Valuation Report is an in-depth analysis detailing your home's value as well as a comparison with similar homes in the area
Home Values in the Area
Average Home Value in this Area
Purchase History
| Date | Buyer | Sale Price | Title Company |
|---|---|---|---|
| Grandview Rentals Llc | -- | Wootton Lance A | |
| Wootton Lance A | -- | None Available | |
| Wootton Lance | $80,000 | None Available | |
| Bradley Rhonda C | $147,000 | None Available |
Source: Public Records
Mortgage History
| Date | Status | Borrower | Loan Amount |
|---|---|---|---|
| Previous Owner | Bradley Rhonda C | $29,390 | |
| Previous Owner | Bradley Rhonda C | $117,560 |
Source: Public Records
Tax History
| Year | Tax Paid | Tax Assessment Tax Assessment Total Assessment is a certain percentage of the fair market value that is determined by local assessors to be the total taxable value of land and additions on the property. | Land | Improvement |
|---|---|---|---|---|
| 2025 | $2,988 | $301,416 | $70,000 | $231,416 |
| 2024 | $1,947 | $148,661 | $33,720 | $114,941 |
| 2023 | $1,947 | $148,661 | $33,720 | $114,941 |
| 2022 | $1,903 | $148,661 | $33,720 | $114,941 |
| 2021 | $1,894 | $148,661 | $33,720 | $114,941 |
| 2020 | $1,849 | $148,661 | $33,720 | $114,941 |
| 2019 | $1,849 | $148,661 | $33,720 | $114,941 |
| 2018 | $1,761 | $129,825 | $28,100 | $101,725 |
| 2017 | $1,748 | $129,825 | $28,100 | $101,725 |
| 2016 | $1,689 | $129,825 | $28,100 | $101,725 |
| 2015 | $1,864 | $134,630 | $28,797 | $105,833 |
| 2014 | $1,864 | $134,630 | $28,797 | $105,833 |
Source: Public Records
Map
Nearby Homes
- 1828 Fletchers Chapel Rd
- 510 Cove Hollow Dr
- 608 Clearfield Dr
- 1742 Fletchers Chapel Rd
- 3721 Brightwood Ln
- 2128 Fletchers Ridge Dr
- 1106 Red Crest Ln
- 1034 Statler Dr
- 1201 Opal Ln
- 1213 Opal Ln
- 1209 Opal Ln
- 509 Pebblestone Dr
- 409 Magna Dr
- 1217 Golden Eagle Dr
- 3403 Cardinal Lake Dr
- 2437 Redwood Rd
- 407 Kinnakeet Dr
- 107 Galena Ct
- 2 Tarrywood Ct
- 4300-4304 Cheek Rd
- 516 Cove Hollow Dr
- 518 Cove Hollow Dr
- 514 Cove Hollow Dr
- 1105 Pebblestone Dr
- 1103 Pebblestone Dr
- 512 Cove Hollow Dr
- 604 Cove Hollow Dr
- 1812 Cove Hollow Dr
- 606 Cove Hollow Dr
- 515 Cove Hollow Dr
- 508 Cove Hollow Dr
- 4008 Rogers Rd
- 517 Cove Hollow Dr
- 519 Cove Hollow Dr
- 1820 Fletchers Chapel Rd
- 511 Cove Hollow Dr
- 601 Cove Hollow Dr
- 608 Cove Hollow Dr
- 603 Cove Hollow Dr
- 506 Cove Hollow Dr