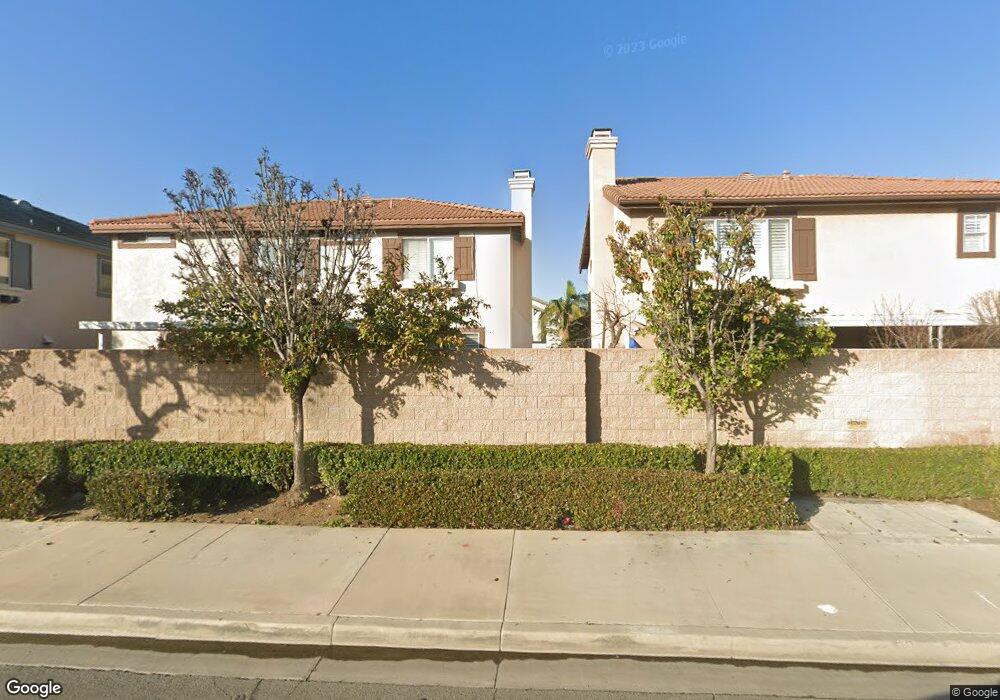
11061 Camellia Way Garden Grove, CA 92840
Estimated Value: $1,048,793 - $1,228,000
3
Beds
3
Baths
1,948
Sq Ft
$592/Sq Ft
Est. Value
About This Home
This home is located at 11061 Camellia Way, Garden Grove, CA 92840 and is currently estimated at $1,152,698, approximately $591 per square foot. 11061 Camellia Way is a home located in Orange County with nearby schools including Parkview Elementary, Lake Intermediate School, and Garden Grove High School.
Ownership History
Date
Name
Owned For
Owner Type
Purchase Details
Closed on
Oct 19, 2020
Sold by
Chau Vien and Nguyen Anhnguyet
Bought by
Chau Vien and Nguyen Anhnguyet
Current Estimated Value
Purchase Details
Closed on
Mar 29, 2005
Sold by
Vuong Mimi
Bought by
Chau Vien and Nguyen Anhnguyet
Purchase Details
Closed on
May 9, 2001
Sold by
Chen Wendi W
Bought by
Chau Vien and Nguyen Anhnguyet
Home Financials for this Owner
Home Financials are based on the most recent Mortgage that was taken out on this home.
Original Mortgage
$270,000
Interest Rate
7.14%
Purchase Details
Closed on
Jun 3, 1998
Sold by
Chapman Euclid Llc
Bought by
Chen Wendi W
Home Financials for this Owner
Home Financials are based on the most recent Mortgage that was taken out on this home.
Original Mortgage
$160,000
Interest Rate
7.11%
Create a Home Valuation Report for This Property
The Home Valuation Report is an in-depth analysis detailing your home's value as well as a comparison with similar homes in the area
Home Values in the Area
Average Home Value in this Area
Purchase History
| Date | Buyer | Sale Price | Title Company |
|---|---|---|---|
| Chau Vien | -- | Ticor Title Company Of Ca | |
| Chau Vien | -- | Civic Center Title Services | |
| Chau Vien | $360,000 | Lawyers Title Company | |
| Chen Wendi W | $255,000 | First American Title Ins Co |
Source: Public Records
Mortgage History
| Date | Status | Borrower | Loan Amount |
|---|---|---|---|
| Previous Owner | Chau Vien | $270,000 | |
| Previous Owner | Chen Wendi W | $160,000 |
Source: Public Records
Tax History Compared to Growth
Tax History
| Year | Tax Paid | Tax Assessment Tax Assessment Total Assessment is a certain percentage of the fair market value that is determined by local assessors to be the total taxable value of land and additions on the property. | Land | Improvement |
|---|---|---|---|---|
| 2025 | $7,855 | $635,750 | $426,471 | $209,279 |
| 2024 | $7,855 | $623,285 | $418,109 | $205,176 |
| 2023 | $7,713 | $611,064 | $409,911 | $201,153 |
| 2022 | $7,543 | $599,083 | $401,874 | $197,209 |
| 2021 | $7,438 | $587,337 | $393,994 | $193,343 |
| 2020 | $7,265 | $581,315 | $389,954 | $191,361 |
| 2019 | $7,164 | $569,917 | $382,308 | $187,609 |
| 2018 | $6,985 | $558,743 | $374,812 | $183,931 |
| 2017 | $6,912 | $547,788 | $367,463 | $180,325 |
| 2016 | $6,560 | $537,048 | $360,258 | $176,790 |
| 2015 | $6,474 | $528,982 | $354,847 | $174,135 |
| 2014 | $6,322 | $518,620 | $347,896 | $170,724 |
Source: Public Records
Map
Nearby Homes
- 10882 Chapman Ave
- 11252 Chapman Ave
- 11102 Avolencia Place
- 12071 Diane St
- 12256 Lesley St
- 2227 S Atlanta St
- 12332 Euclid St
- 11081 Iris Dr
- 11762 Gary St
- 11552 9th St
- 11052 Peppertree Ln
- 12555 S Euclid St Unit 32
- 11441 Dolan St
- 12555 Euclid St Unit 79
- 12555 Euclid St Unit 61
- 12600 Euclid St Unit 19
- 11301 Euclid St Unit 60
- 11301 Euclid St Unit 21
- 10691 Perrin Dr
- 11731 Rose Dr
- 11073 Camellia Way
- 11052 Lavender Ln
- 11081 Camellia Way
- 11066 Camellia Way
- 11072 Camellia Way
- 11071 Lavender Ln
- 11061 Lavender Ln
- 11052 Camellia Way
- 11051 Lavender Ln
- 11081 Lavender Ln
- 11082 Camellia Way
- 11092 Lavender Ln
- 11042 Camellia Way
- 11041 Lavender Ln
- 11030 Camellia Way
- 11091 Lavender Ln
- 11032 Camellia Way
- 11033 Lavender Ln
- 11036 Camellia Way
- 11037 Lavender Ln