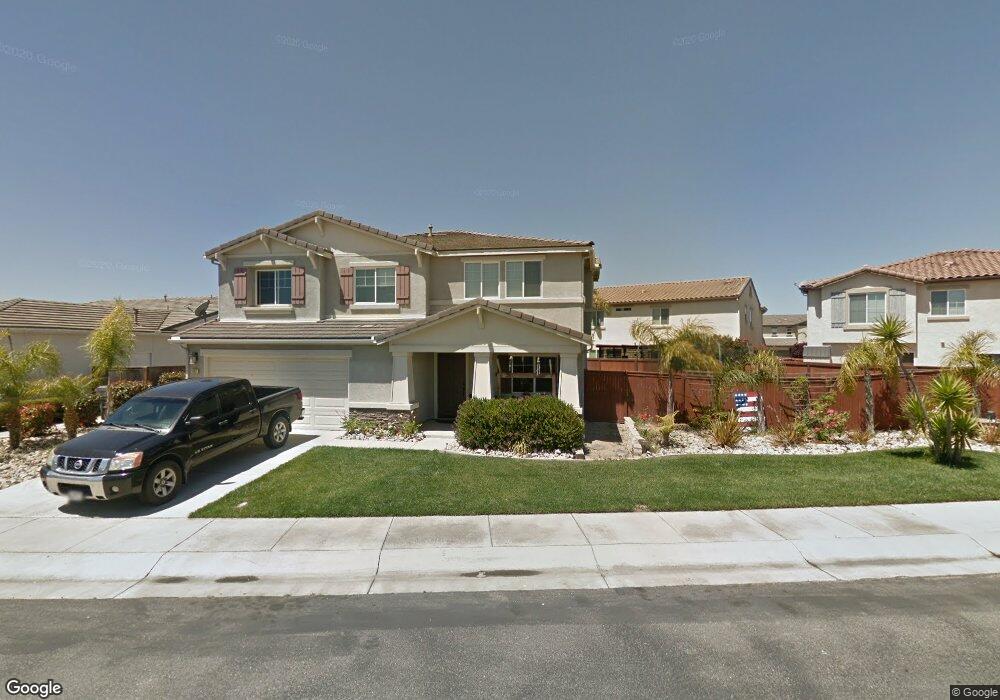
1107 Point Sal Loop Lompoc, CA 93436
Estimated Value: $737,000 - $810,000
4
Beds
3
Baths
2,656
Sq Ft
$287/Sq Ft
Est. Value
About This Home
This home is located at 1107 Point Sal Loop, Lompoc, CA 93436 and is currently estimated at $761,832, approximately $286 per square foot. 1107 Point Sal Loop is a home located in Santa Barbara County with nearby schools including Clarence Ruth Elementary School, Lompoc Valley Middle School, and Lompoc High School.
Ownership History
Date
Name
Owned For
Owner Type
Purchase Details
Closed on
Oct 18, 2022
Sold by
Bolles Roy Evan and Bolles Dawnelle
Bought by
Cervantes Brina K S and Cervantes Elias
Current Estimated Value
Home Financials for this Owner
Home Financials are based on the most recent Mortgage that was taken out on this home.
Original Mortgage
$700,755
Outstanding Balance
$678,278
Interest Rate
6.94%
Mortgage Type
VA
Estimated Equity
$83,554
Purchase Details
Closed on
Apr 1, 2008
Sold by
Centex Homes
Bought by
Bolles Roy Evan and Bolles Dawnelle
Home Financials for this Owner
Home Financials are based on the most recent Mortgage that was taken out on this home.
Original Mortgage
$409,315
Interest Rate
5.88%
Mortgage Type
VA
Create a Home Valuation Report for This Property
The Home Valuation Report is an in-depth analysis detailing your home's value as well as a comparison with similar homes in the area
Home Values in the Area
Average Home Value in this Area
Purchase History
| Date | Buyer | Sale Price | Title Company |
|---|---|---|---|
| Cervantes Brina K S | $685,000 | First American Title | |
| Bolles Roy Evan | -- | Commerce Title Company |
Source: Public Records
Mortgage History
| Date | Status | Borrower | Loan Amount |
|---|---|---|---|
| Open | Cervantes Brina K S | $700,755 | |
| Previous Owner | Bolles Roy Evan | $409,315 |
Source: Public Records
Tax History
| Year | Tax Paid | Tax Assessment Tax Assessment Total Assessment is a certain percentage of the fair market value that is determined by local assessors to be the total taxable value of land and additions on the property. | Land | Improvement |
|---|---|---|---|---|
| 2025 | $5,855 | $712,674 | $208,080 | $504,594 |
| 2023 | $5,855 | $685,000 | $200,000 | $485,000 |
| 2022 | $5,537 | $495,955 | $160,901 | $335,054 |
| 2021 | $5,599 | $486,232 | $157,747 | $328,485 |
| 2020 | $5,539 | $481,247 | $156,130 | $325,117 |
| 2019 | $5,447 | $471,812 | $153,069 | $318,743 |
| 2018 | $5,362 | $462,562 | $150,068 | $312,494 |
| 2017 | $5,263 | $453,493 | $147,126 | $306,367 |
| 2016 | $4,773 | $411,000 | $133,000 | $278,000 |
| 2014 | $3,992 | $340,000 | $110,000 | $230,000 |
Source: Public Records
Map
Nearby Homes
- 1103 Point Sal Loop
- 2205 Point Sal Loop
- 1416 Glen Ellen Ln
- 1212 Timothy Ct
- 1012 W Anthony Way
- 600 N Y St
- 1344 Village Meadows Dr
- 901 Alden Ave
- 516 N U St
- 420 N W St
- 1355 Crown Cir
- 321 N Z St
- 531 N O St
- 0 Floradale Ave
- 321 W North Ave Unit 133
- 112 N X St
- 1408 W Walnut Ave
- 267 Village Circle Dr
- 1011 W Walnut Ave
- 1410 W Apricot Ave
- 1110 Conception Dr
- 1114 Conception Dr
- 1106 Conception Dr
- 2023 San Antonio Ct
- 1102 Conception Dr
- 1031 Point Sal Loop
- 1110 Point Sal Loop
- 1114 Point Sal Loop
- 1028 Conception Dr
- 2019 San Antonio Ct
- 1118 Point Sal Loop
- 1027 Point Sal Loop
- 2014 San Antonio Ct
- 1113 Conception Dr
- 1109 Conception Dr
- 2008 Conception Dr
- 1024 Conception Dr
- 2012 Conception Dr
Your Personal Tour Guide
Ask me questions while you tour the home.