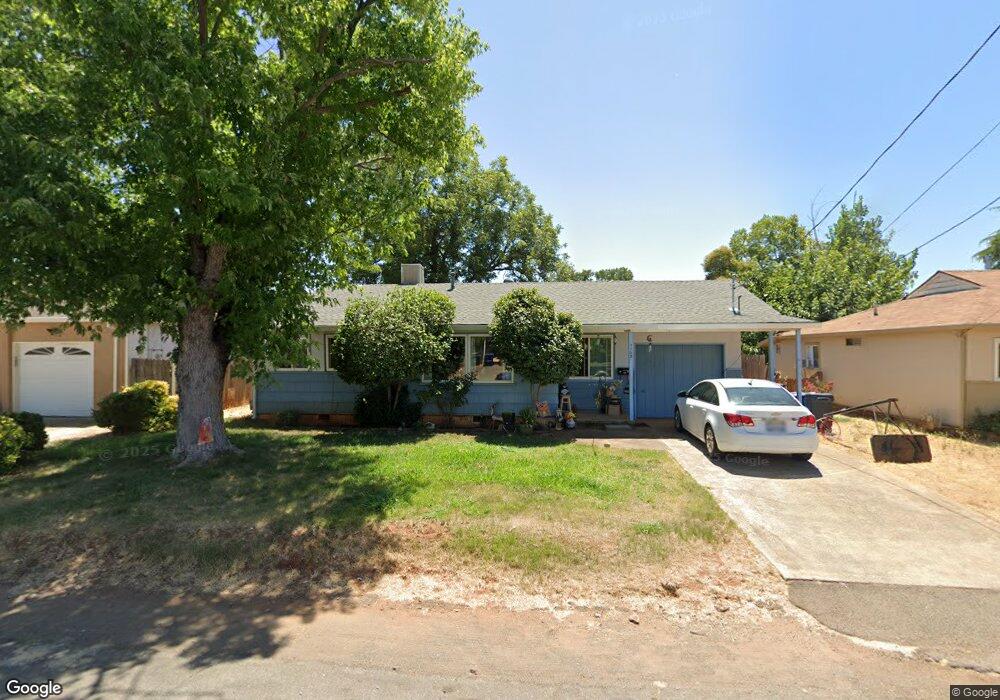
1108 2nd St Redding, CA 96002
South Bechelli NeighborhoodEstimated Value: $204,000 - $270,000
3
Beds
1
Bath
927
Sq Ft
$251/Sq Ft
Est. Value
About This Home
This home is located at 1108 2nd St, Redding, CA 96002 and is currently estimated at $232,666, approximately $250 per square foot. 1108 2nd St is a home located in Shasta County with nearby schools including Rother Elementary School, Parsons Junior High School, and Enterprise High School.
Ownership History
Date
Name
Owned For
Owner Type
Purchase Details
Closed on
Apr 8, 2021
Sold by
Molina Elizabeth and Molina Frank A
Bought by
Molina Elizabeth and Molina Frank A
Current Estimated Value
Home Financials for this Owner
Home Financials are based on the most recent Mortgage that was taken out on this home.
Original Mortgage
$111,000
Outstanding Balance
$83,161
Interest Rate
2.9%
Mortgage Type
New Conventional
Estimated Equity
$149,505
Purchase Details
Closed on
May 5, 2014
Sold by
Molina Elizabeth
Bought by
Molina Elizabeth and Molina Frank A
Purchase Details
Closed on
Apr 24, 1998
Sold by
Hud
Bought by
Molina Elizabeth
Home Financials for this Owner
Home Financials are based on the most recent Mortgage that was taken out on this home.
Original Mortgage
$70,143
Interest Rate
7.06%
Mortgage Type
FHA
Purchase Details
Closed on
Jan 10, 1998
Sold by
Chase Mtg Services Inc
Bought by
Hud
Purchase Details
Closed on
Oct 30, 1997
Sold by
Loesch Roger P and Loesch Delora D
Bought by
Chase Mtg Services Inc and Chase Manhattan Mtg Corp
Create a Home Valuation Report for This Property
The Home Valuation Report is an in-depth analysis detailing your home's value as well as a comparison with similar homes in the area
Home Values in the Area
Average Home Value in this Area
Purchase History
| Date | Buyer | Sale Price | Title Company |
|---|---|---|---|
| Molina Elizabeth | -- | Timios Title A Ca Corp | |
| Molina Elizabeth | -- | None Available | |
| Molina Elizabeth | $69,500 | Stewart Title | |
| Hud | -- | Fidelity National Title Ins | |
| Chase Mtg Services Inc | $68,838 | Fidelity National Title Ins |
Source: Public Records
Mortgage History
| Date | Status | Borrower | Loan Amount |
|---|---|---|---|
| Open | Molina Elizabeth | $111,000 | |
| Closed | Molina Elizabeth | $70,143 |
Source: Public Records
Tax History
| Year | Tax Paid | Tax Assessment Tax Assessment Total Assessment is a certain percentage of the fair market value that is determined by local assessors to be the total taxable value of land and additions on the property. | Land | Improvement |
|---|---|---|---|---|
| 2025 | $1,148 | $110,305 | $28,730 | $81,575 |
| 2024 | $1,130 | $108,143 | $28,167 | $79,976 |
| 2023 | $1,130 | $106,023 | $27,615 | $78,408 |
| 2022 | $1,096 | $103,945 | $27,074 | $76,871 |
| 2021 | $1,057 | $101,908 | $26,544 | $75,364 |
| 2020 | $1,052 | $100,864 | $26,272 | $74,592 |
| 2019 | $1,042 | $98,887 | $25,757 | $73,130 |
| 2018 | $1,028 | $96,949 | $25,252 | $71,697 |
| 2017 | $1,044 | $95,049 | $24,757 | $70,292 |
| 2016 | $976 | $93,186 | $24,272 | $68,914 |
| 2015 | $966 | $91,787 | $23,908 | $67,879 |
| 2014 | $958 | $89,990 | $23,440 | $66,550 |
Source: Public Records
Map
Nearby Homes
- 1209 C St
- 1108 4th St
- 3428 Adams Ln
- 3650 Cheryl Dr
- 3527 Adams Ln
- 737 Estate St
- 688 Julie Way
- 3689 Suzanne Way
- 3708 Traverse St
- 3087 Northwoods Way
- 1091 Del Sol Place
- 1075 Le Brun Ln
- 890 Parsons Dr
- 918 Parsons Dr
- 0 Churn Creek Rd Unit 25-496
- 0 Churn Creek Rd Unit 26-609
- 0 Churn Creek Rd Unit 25-5491
- 2935 Shotwick Trail
- 3081 Henderson Rd
- 3178 Lawrence Rd
Your Personal Tour Guide
Ask me questions while you tour the home.