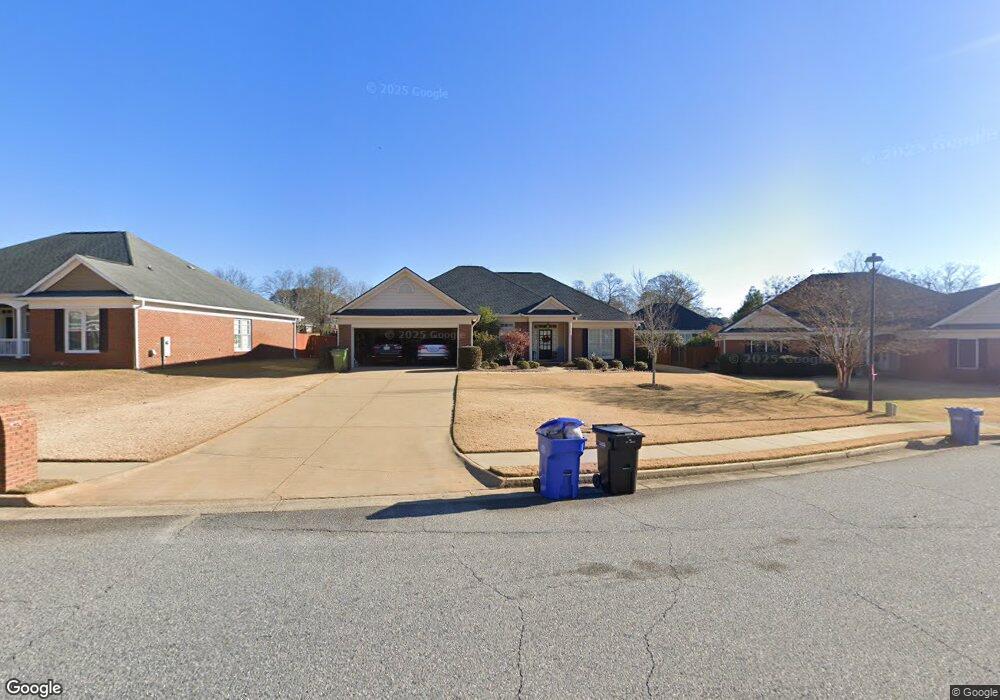
1108 Mobley Walk Ct Columbus, GA 31904
North Columbus NeighborhoodEstimated Value: $301,983 - $340,000
3
Beds
3
Baths
1,867
Sq Ft
$170/Sq Ft
Est. Value
About This Home
This home is located at 1108 Mobley Walk Ct, Columbus, GA 31904 and is currently estimated at $317,996, approximately $170 per square foot. 1108 Mobley Walk Ct is a home located in Muscogee County with nearby schools including Double Churches Elementary School, Double Churches Middle School, and Northside High School.
Ownership History
Date
Name
Owned For
Owner Type
Purchase Details
Closed on
Jun 29, 2017
Sold by
Calhoun Lawrence H
Bought by
Marouene Melki
Current Estimated Value
Home Financials for this Owner
Home Financials are based on the most recent Mortgage that was taken out on this home.
Original Mortgage
$173,600
Outstanding Balance
$91,806
Interest Rate
3.94%
Mortgage Type
New Conventional
Estimated Equity
$226,190
Purchase Details
Closed on
Oct 10, 2013
Sold by
Hicks Stacy D
Bought by
Calhoun Lawrence H
Home Financials for this Owner
Home Financials are based on the most recent Mortgage that was taken out on this home.
Original Mortgage
$157,000
Interest Rate
4.57%
Mortgage Type
New Conventional
Purchase Details
Closed on
Oct 11, 2011
Sold by
Grenier Marc
Bought by
Hicks Stacey D
Home Financials for this Owner
Home Financials are based on the most recent Mortgage that was taken out on this home.
Original Mortgage
$131,940
Interest Rate
4.16%
Mortgage Type
New Conventional
Create a Home Valuation Report for This Property
The Home Valuation Report is an in-depth analysis detailing your home's value as well as a comparison with similar homes in the area
Home Values in the Area
Average Home Value in this Area
Purchase History
| Date | Buyer | Sale Price | Title Company |
|---|---|---|---|
| Marouene Melki | $217,000 | -- | |
| Calhoun Lawrence H | $205,000 | -- | |
| Hicks Stacey D | $219,900 | -- |
Source: Public Records
Mortgage History
| Date | Status | Borrower | Loan Amount |
|---|---|---|---|
| Open | Marouene Melki | $173,600 | |
| Previous Owner | Calhoun Lawrence H | $157,000 | |
| Previous Owner | Hicks Stacey D | $131,940 |
Source: Public Records
Tax History Compared to Growth
Tax History
| Year | Tax Paid | Tax Assessment Tax Assessment Total Assessment is a certain percentage of the fair market value that is determined by local assessors to be the total taxable value of land and additions on the property. | Land | Improvement |
|---|---|---|---|---|
| 2025 | $2,710 | $95,660 | $22,880 | $72,780 |
| 2024 | $2,709 | $95,660 | $22,880 | $72,780 |
| 2023 | $2,032 | $95,660 | $22,880 | $72,780 |
| 2022 | $2,825 | $81,180 | $17,160 | $64,020 |
| 2021 | $3,141 | $82,416 | $17,160 | $65,256 |
| 2020 | $2,819 | $82,416 | $17,160 | $65,256 |
| 2019 | $2,830 | $82,416 | $17,160 | $65,256 |
| 2018 | $3,377 | $82,416 | $17,160 | $65,256 |
| 2017 | $3,387 | $82,416 | $17,160 | $65,256 |
| 2016 | $3,383 | $82,000 | $20,000 | $62,000 |
| 2015 | $3,387 | $82,000 | $20,000 | $62,000 |
| 2014 | $3,391 | $82,000 | $20,000 | $62,000 |
| 2013 | -- | $87,960 | $20,000 | $67,960 |
Source: Public Records
Map
Nearby Homes
- 7233 Mobley Walk Dr
- 16 Kylemore Ct
- 6836 Sharmel Ln
- 6969 Mobley Rd
- 1440 Blanchfield Dr
- 6825 Ellis Dr
- 6802 Ellis Dr
- 7047 Mellwood Rd
- 6333 Cape Cod Dr
- 6817 Whitesville Rd
- 1355 Cloverdale Rd
- 7020 Redwood Dr
- 6390 Cape Cod Dr
- 6818 Fawndale Dr
- 6810 Fawndale Dr
- 1255 Woodville Ct
- 1512 Tom Buk Tu Ln
- 235 Pebblebrook Ln
- 280 Zachary Ct
- 5 Bridgecreek Ct
- 1116 Mobley Walk Ct
- 1104 Mobley Walk Ct
- 7214 Mobley Walk Dr
- 7222 Mobley Walk Dr
- 1124 Mobley Walk Ct
- 7206 Mobley Walk Dr
- 1113 Mobley Walk Ct
- 1132 Mobley Walk Ct
- 1109 Mobley Walk Ct
- 1100 Mobley Walk Ct
- 7238 Mobley Walk Dr
- 1117 Mobley Walk Ct
- 1105 Mobley Walk Ct
- 1148 Mobley Walk Ct
- 1125 Mobley Walk Ct
- 7246 Mobley Walk Dr
- 1121 Mobley Walk Ct
- 7225 Mobley Walk Dr
- 957 Lismore Dr
- 953 Lismore Dr