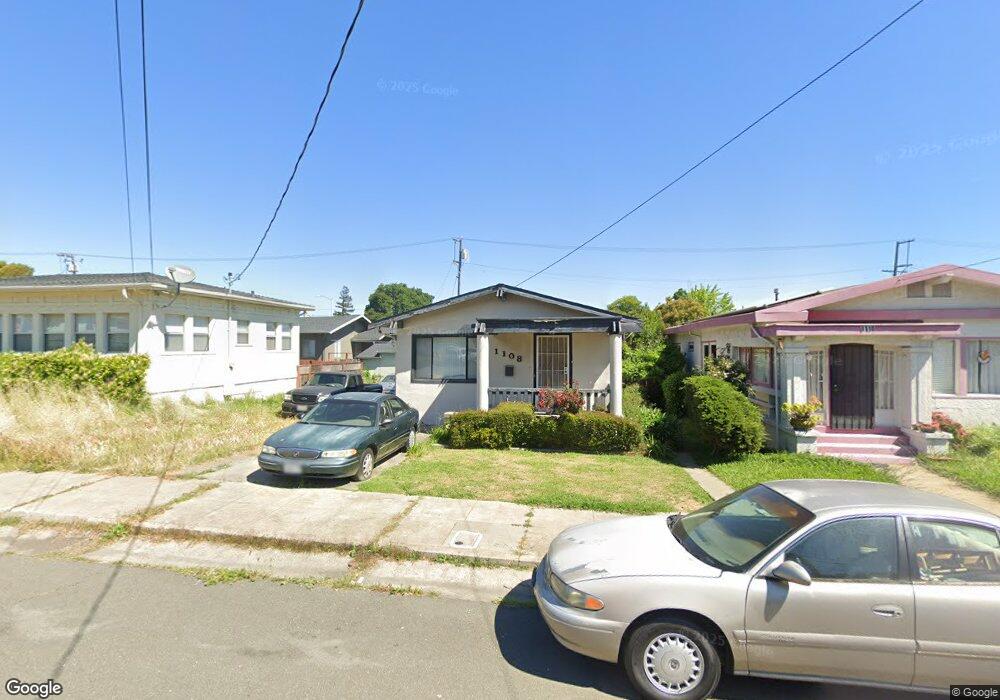
1108 Ohio St Vallejo, CA 94590
West Vallejo NeighborhoodEstimated Value: $284,000 - $343,000
1
Bed
1
Bath
792
Sq Ft
$403/Sq Ft
Est. Value
About This Home
This home is located at 1108 Ohio St, Vallejo, CA 94590 and is currently estimated at $319,471, approximately $403 per square foot. 1108 Ohio St is a home located in Solano County with nearby schools including Highland Elementary, Vallejo High School, and Caliber: ChangeMakers Academy.
Ownership History
Date
Name
Owned For
Owner Type
Purchase Details
Closed on
Oct 23, 2015
Sold by
Lee Kimberly J
Bought by
Lee Robert M and Lee Kimberly J
Current Estimated Value
Home Financials for this Owner
Home Financials are based on the most recent Mortgage that was taken out on this home.
Original Mortgage
$135,000
Interest Rate
3.87%
Mortgage Type
New Conventional
Purchase Details
Closed on
Dec 24, 2002
Sold by
Lee Kimberly J and Lee Robert
Bought by
Lee Kimberly J
Home Financials for this Owner
Home Financials are based on the most recent Mortgage that was taken out on this home.
Original Mortgage
$85,000
Interest Rate
6.06%
Create a Home Valuation Report for This Property
The Home Valuation Report is an in-depth analysis detailing your home's value as well as a comparison with similar homes in the area
Home Values in the Area
Average Home Value in this Area
Purchase History
| Date | Buyer | Sale Price | Title Company |
|---|---|---|---|
| Lee Robert M | -- | Orange Coast Title Company | |
| Lee Kimberly J | -- | Chicago Title Co |
Source: Public Records
Mortgage History
| Date | Status | Borrower | Loan Amount |
|---|---|---|---|
| Closed | Lee Robert M | $135,000 | |
| Closed | Lee Kimberly J | $85,000 |
Source: Public Records
Tax History
| Year | Tax Paid | Tax Assessment Tax Assessment Total Assessment is a certain percentage of the fair market value that is determined by local assessors to be the total taxable value of land and additions on the property. | Land | Improvement |
|---|---|---|---|---|
| 2025 | $2,702 | $149,009 | $64,386 | $84,623 |
| 2024 | $2,702 | $146,088 | $63,124 | $82,964 |
| 2023 | $2,506 | $143,225 | $61,887 | $81,338 |
| 2022 | $2,397 | $140,418 | $60,674 | $79,744 |
| 2021 | $2,341 | $137,666 | $59,485 | $78,181 |
| 2020 | $2,332 | $136,256 | $58,876 | $77,380 |
| 2019 | $2,241 | $133,585 | $57,722 | $75,863 |
| 2018 | $2,084 | $130,967 | $56,591 | $74,376 |
| 2017 | $1,972 | $128,400 | $55,482 | $72,918 |
| 2016 | $1,400 | $125,884 | $54,395 | $71,489 |
| 2015 | $1,476 | $123,994 | $53,578 | $70,416 |
| 2014 | $1,285 | $115,000 | $46,000 | $69,000 |
Source: Public Records
Map
Nearby Homes
Your Personal Tour Guide
Ask me questions while you tour the home.