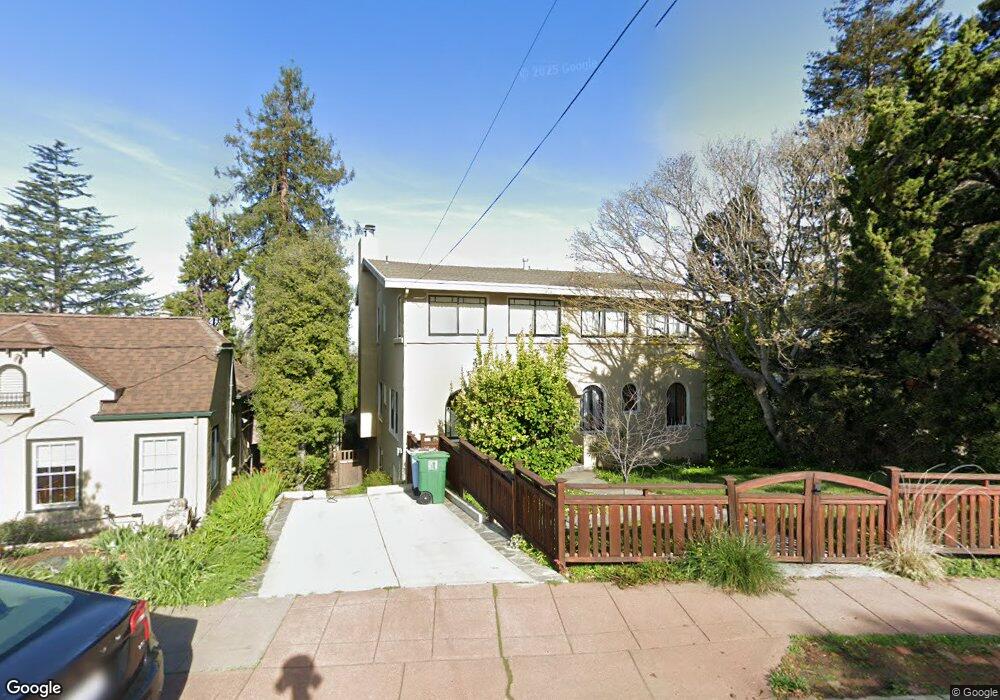
1108 Shattuck Ave Berkeley, CA 94707
Berkeley Hills NeighborhoodEstimated Value: $2,329,657 - $2,911,000
4
Beds
3
Baths
2,622
Sq Ft
$969/Sq Ft
Est. Value
About This Home
This home is located at 1108 Shattuck Ave, Berkeley, CA 94707 and is currently estimated at $2,539,414, approximately $968 per square foot. 1108 Shattuck Ave is a home located in Alameda County with nearby schools including Berkeley Arts Magnet at Whittier School, Cragmont Elementary School, and Washington Elementary School.
Ownership History
Date
Name
Owned For
Owner Type
Purchase Details
Closed on
Jun 21, 2010
Sold by
Reiter Jeremy and Ma Christine
Bought by
Reiter Jeremy F and Ma Christine T
Current Estimated Value
Home Financials for this Owner
Home Financials are based on the most recent Mortgage that was taken out on this home.
Original Mortgage
$1,000,000
Outstanding Balance
$817,818
Interest Rate
4.91%
Mortgage Type
Purchase Money Mortgage
Estimated Equity
$1,721,596
Purchase Details
Closed on
Jun 7, 2010
Sold by
Knight Bonnie Moone and Knight John C
Bought by
Reiter Jeremy and Ma Christine
Home Financials for this Owner
Home Financials are based on the most recent Mortgage that was taken out on this home.
Original Mortgage
$1,000,000
Outstanding Balance
$817,818
Interest Rate
4.91%
Mortgage Type
Purchase Money Mortgage
Estimated Equity
$1,721,596
Purchase Details
Closed on
Jul 4, 2000
Sold by
Schneider Wallace Lisa Sanford and Schneider Jamner Margaret
Bought by
Wallace Lisa Sanford and Wallace Walter
Create a Home Valuation Report for This Property
The Home Valuation Report is an in-depth analysis detailing your home's value as well as a comparison with similar homes in the area
Home Values in the Area
Average Home Value in this Area
Purchase History
| Date | Buyer | Sale Price | Title Company |
|---|---|---|---|
| Reiter Jeremy F | -- | Chicago Title Company | |
| Reiter Jeremy | $1,225,000 | Chicago Title Company | |
| Wallace Lisa Sanford | $125,000 | Financial Title Company |
Source: Public Records
Mortgage History
| Date | Status | Borrower | Loan Amount |
|---|---|---|---|
| Open | Reiter Jeremy | $1,000,000 |
Source: Public Records
Tax History
| Year | Tax Paid | Tax Assessment Tax Assessment Total Assessment is a certain percentage of the fair market value that is determined by local assessors to be the total taxable value of land and additions on the property. | Land | Improvement |
|---|---|---|---|---|
| 2025 | $24,346 | $1,592,079 | $474,343 | $1,124,736 |
| 2024 | $24,346 | $1,560,735 | $465,045 | $1,102,690 |
| 2023 | $23,841 | $1,536,997 | $455,927 | $1,081,070 |
| 2022 | $23,411 | $1,499,868 | $446,990 | $1,059,878 |
| 2021 | $23,471 | $1,470,333 | $438,229 | $1,039,104 |
| 2020 | $22,180 | $1,462,193 | $433,738 | $1,028,455 |
| 2019 | $21,282 | $1,433,525 | $425,234 | $1,008,291 |
| 2018 | $20,924 | $1,405,427 | $416,899 | $988,528 |
| 2017 | $20,227 | $1,377,874 | $408,726 | $969,148 |
| 2016 | $19,573 | $1,350,866 | $400,714 | $950,152 |
| 2015 | $19,310 | $1,330,585 | $394,698 | $935,887 |
| 2014 | $19,121 | $1,304,532 | $386,970 | $917,562 |
Source: Public Records
Map
Nearby Homes
- 2121 Eunice St
- 1950 Hopkins St
- 938 San Benito Rd
- 2315 Eunice St
- 1004 Cragmont Ave
- 1325 Henry St
- 813 San Diego Rd
- 1408 Henry St
- 962 Regal Rd
- 1444 Walnut St
- 1425 Martin Luther King jr Way
- 1106 Cragmont Ave
- 1741 Sonoma Ave
- 758 Spruce St
- 765 San Diego Rd
- 1515 Oxford St Unit 1D
- 2501 Rose Walk
- 1983 Yosemite Rd
- 1841 Vine St
- 777 Cragmont Ave
- 1112 Shattuck Ave
- 1104 Shattuck Ave
- 1126 Shattuck Ave
- 70 Terrace Walk
- 1100 Shattuck Ave
- 1053 Mariposa Ave
- 1057 Mariposa Ave
- 1111 Shattuck Ave
- 1049 Mariposa Ave
- 1128 Shattuck Ave
- 1115 Shattuck Ave
- 1101 Shattuck Ave
- 1061 Mariposa Ave
- 1047 Mariposa Ave
- 1108 Walnut St
- 1119 Shattuck Ave
- 1042 Shattuck Ave
- 1065 Mariposa Ave
- 1045 Mariposa Ave
- 1069 Mariposa Ave
Your Personal Tour Guide
Ask me questions while you tour the home.