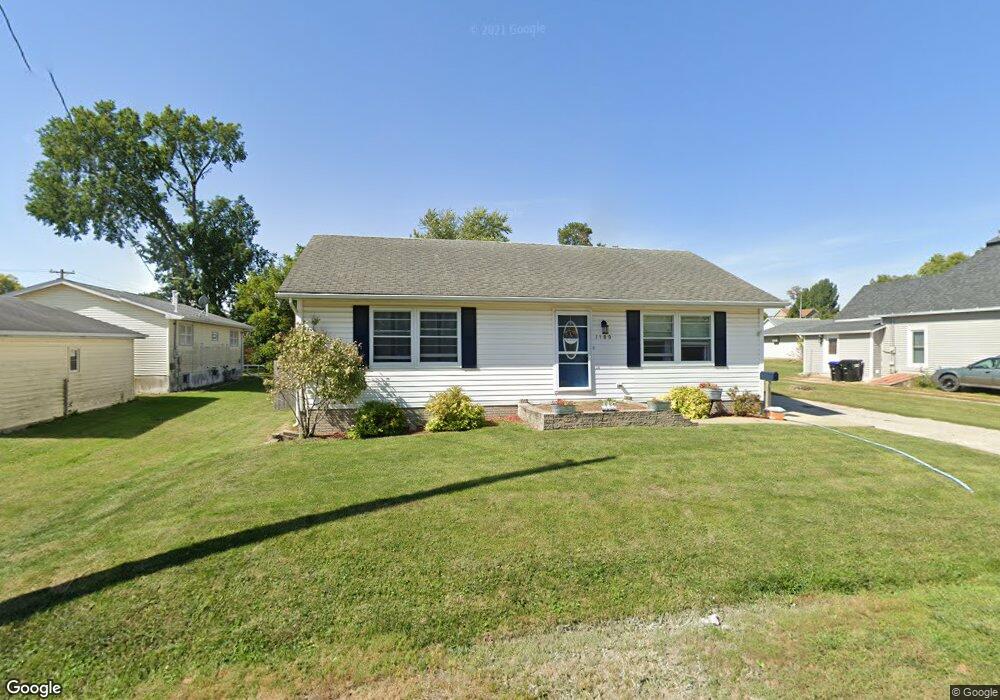
1109 4th Ave Vinton, IA 52349
Estimated Value: $161,000 - $218,000
4
Beds
2
Baths
1,120
Sq Ft
$173/Sq Ft
Est. Value
About This Home
This home is located at 1109 4th Ave, Vinton, IA 52349 and is currently estimated at $194,105, approximately $173 per square foot. 1109 4th Ave is a home located in Benton County with nearby schools including Tilford Elementary School, Shellsburg Elementary School, and Vinton-Shellsburg Middle School.
Ownership History
Date
Name
Owned For
Owner Type
Purchase Details
Closed on
Aug 25, 2005
Sold by
Hanna Jerry L and Hanna Marva A
Bought by
Neilson Douglas E and Neilson Danielle D
Current Estimated Value
Home Financials for this Owner
Home Financials are based on the most recent Mortgage that was taken out on this home.
Original Mortgage
$107,300
Outstanding Balance
$53,957
Interest Rate
5%
Mortgage Type
Adjustable Rate Mortgage/ARM
Estimated Equity
$140,148
Create a Home Valuation Report for This Property
The Home Valuation Report is an in-depth analysis detailing your home's value as well as a comparison with similar homes in the area
Home Values in the Area
Average Home Value in this Area
Purchase History
| Date | Buyer | Sale Price | Title Company |
|---|---|---|---|
| Neilson Douglas E | $108,500 | None Available |
Source: Public Records
Mortgage History
| Date | Status | Borrower | Loan Amount |
|---|---|---|---|
| Open | Neilson Douglas E | $107,300 |
Source: Public Records
Tax History Compared to Growth
Tax History
| Year | Tax Paid | Tax Assessment Tax Assessment Total Assessment is a certain percentage of the fair market value that is determined by local assessors to be the total taxable value of land and additions on the property. | Land | Improvement |
|---|---|---|---|---|
| 2025 | $2,872 | $177,200 | $16,500 | $160,700 |
| 2024 | $2,872 | $163,500 | $16,500 | $147,000 |
| 2023 | $2,774 | $163,500 | $16,500 | $147,000 |
| 2022 | $2,846 | $137,800 | $13,200 | $124,600 |
| 2021 | $2,846 | $137,800 | $13,200 | $124,600 |
| 2020 | $2,484 | $123,600 | $11,200 | $112,400 |
| 2019 | $2,526 | $123,600 | $11,200 | $112,400 |
| 2018 | $2,450 | $123,800 | $10,600 | $113,200 |
| 2017 | $2,150 | $123,800 | $10,600 | $113,200 |
| 2016 | $2,110 | $106,500 | $9,900 | $96,600 |
| 2015 | $2,110 | $106,500 | $9,900 | $96,600 |
| 2014 | $2,200 | $110,400 | $0 | $0 |
Source: Public Records
Map
Nearby Homes