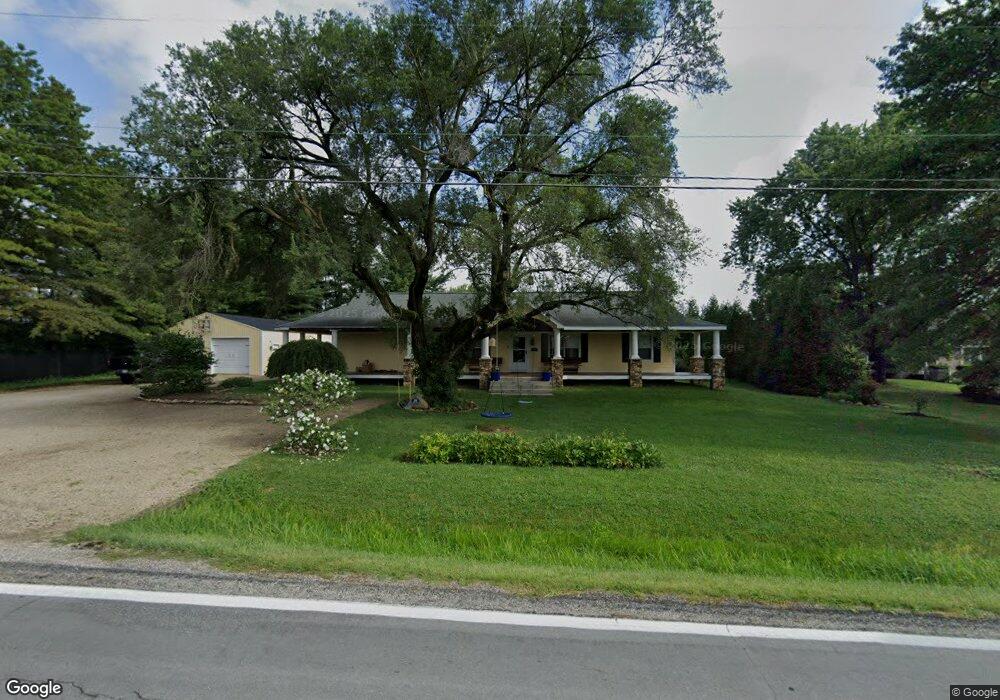
1109 Alton Rd Galloway, OH 43119
Estimated Value: $303,000 - $399,000
3
Beds
2
Baths
1,764
Sq Ft
$202/Sq Ft
Est. Value
About This Home
This home is located at 1109 Alton Rd, Galloway, OH 43119 and is currently estimated at $356,749, approximately $202 per square foot. 1109 Alton Rd is a home with nearby schools including Alton Hall Elementary School, Galloway Ridge Intermediate School, and Pleasant View Middle School.
Ownership History
Date
Name
Owned For
Owner Type
Purchase Details
Closed on
Jan 10, 2014
Sold by
Queen William A and Queen Lillian Holly
Bought by
Queen William A and Queen Lillian Holly
Current Estimated Value
Purchase Details
Closed on
Sep 20, 2007
Sold by
Queen William A and Queen Terri L
Bought by
Queen William A
Home Financials for this Owner
Home Financials are based on the most recent Mortgage that was taken out on this home.
Original Mortgage
$127,736
Outstanding Balance
$80,791
Interest Rate
6.55%
Mortgage Type
Purchase Money Mortgage
Estimated Equity
$275,958
Purchase Details
Closed on
Oct 21, 1993
Sold by
American Housing Trust I
Bought by
Queen William A and Queen Terri L
Purchase Details
Closed on
Jul 5, 1988
Bought by
American Housing Trust I
Purchase Details
Closed on
Nov 25, 1987
Purchase Details
Closed on
Oct 1, 1979
Create a Home Valuation Report for This Property
The Home Valuation Report is an in-depth analysis detailing your home's value as well as a comparison with similar homes in the area
Home Values in the Area
Average Home Value in this Area
Purchase History
| Date | Buyer | Sale Price | Title Company |
|---|---|---|---|
| Queen William A | -- | None Available | |
| Queen William A | -- | Valmer Land Title Agency | |
| Queen William A | $35,500 | Title First Agency Inc | |
| American Housing Trust I | -- | -- | |
| -- | -- | -- | |
| -- | $41,000 | -- |
Source: Public Records
Mortgage History
| Date | Status | Borrower | Loan Amount |
|---|---|---|---|
| Open | Queen William A | $127,736 |
Source: Public Records
Tax History Compared to Growth
Tax History
| Year | Tax Paid | Tax Assessment Tax Assessment Total Assessment is a certain percentage of the fair market value that is determined by local assessors to be the total taxable value of land and additions on the property. | Land | Improvement |
|---|---|---|---|---|
| 2024 | $4,733 | $104,970 | $14,460 | $90,510 |
| 2023 | $4,517 | $104,965 | $14,455 | $90,510 |
| 2022 | $4,351 | $71,090 | $9,490 | $61,600 |
| 2021 | $4,421 | $71,090 | $9,490 | $61,600 |
| 2020 | $4,158 | $67,140 | $9,490 | $57,650 |
| 2019 | $4,193 | $59,150 | $8,260 | $50,890 |
| 2018 | $3,821 | $60,520 | $8,260 | $52,260 |
| 2017 | $3,659 | $59,150 | $8,260 | $50,890 |
| 2016 | $3,365 | $46,060 | $8,260 | $37,800 |
| 2015 | $3,364 | $46,060 | $8,260 | $37,800 |
| 2014 | $3,367 | $46,060 | $8,260 | $37,800 |
| 2013 | $1,670 | $46,060 | $8,260 | $37,800 |
Source: Public Records
Map
Nearby Homes
- 6699 Hall Rd
- 6567 Hall Rd
- 6532 Birch Park Dr
- 728 Murnan Rd
- 6351 Greenhaven Ave
- 6317 Oak Trail Dr
- 6369 Bellmouth Rd
- 6393 Bellmouth Rd
- 6379 Bellmouth Rd
- 6192 Hazelmere Dr
- 669 Gleaming Dr Unit 248
- 6332 Pandrol St
- 663 Gleaming Dr Unit 249
- 6109 Nasby Dr
- Chatham Plan at Chase Landings
- Bellamy Plan at Chase Landings
- Pendleton Plan at Chase Landings
- Sienna Plan at Chase Landings
- Aldridge Plan at Chase Landings
- Henley Plan at Chase Landings