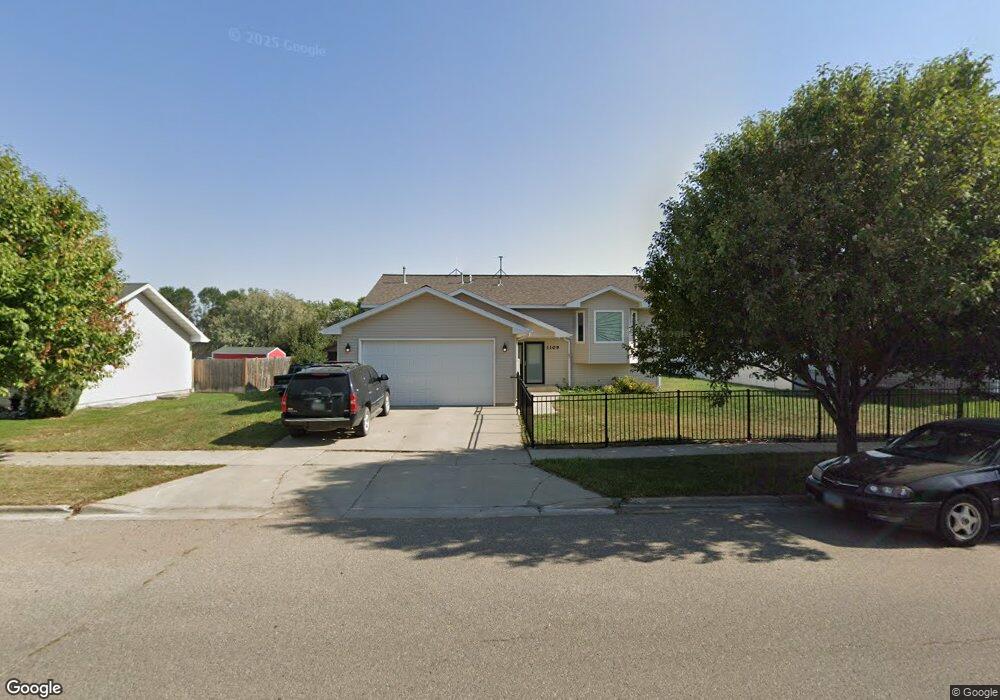
1109 Knoll St Williston, ND 58801
Estimated Value: $318,000 - $382,000
2
Beds
2
Baths
1,250
Sq Ft
$281/Sq Ft
Est. Value
About This Home
This home is located at 1109 Knoll St, Williston, ND 58801 and is currently estimated at $350,711, approximately $280 per square foot. 1109 Knoll St is a home located in Williams County with nearby schools including Williston High School and Williston Trinity Christian School.
Ownership History
Date
Name
Owned For
Owner Type
Purchase Details
Closed on
May 22, 2006
Sold by
Wendel Gary D and Wendel Bonnie J
Bought by
Arcand Kathren C
Current Estimated Value
Home Financials for this Owner
Home Financials are based on the most recent Mortgage that was taken out on this home.
Original Mortgage
$118,400
Outstanding Balance
$69,431
Interest Rate
6.62%
Mortgage Type
New Conventional
Estimated Equity
$281,280
Create a Home Valuation Report for This Property
The Home Valuation Report is an in-depth analysis detailing your home's value as well as a comparison with similar homes in the area
Home Values in the Area
Average Home Value in this Area
Purchase History
| Date | Buyer | Sale Price | Title Company |
|---|---|---|---|
| Arcand Kathren C | $148,000 | None Available |
Source: Public Records
Mortgage History
| Date | Status | Borrower | Loan Amount |
|---|---|---|---|
| Open | Arcand Kathren C | $118,400 |
Source: Public Records
Tax History Compared to Growth
Tax History
| Year | Tax Paid | Tax Assessment Tax Assessment Total Assessment is a certain percentage of the fair market value that is determined by local assessors to be the total taxable value of land and additions on the property. | Land | Improvement |
|---|---|---|---|---|
| 2024 | $2,422 | $158,050 | $43,225 | $114,825 |
| 2023 | $2,677 | $149,585 | $0 | $0 |
| 2022 | $2,599 | $140,990 | $0 | $0 |
| 2021 | $2,495 | $135,950 | $43,225 | $92,725 |
| 2020 | $2,438 | $134,450 | $43,250 | $91,200 |
| 2019 | $2,405 | $122,700 | $43,250 | $79,450 |
| 2018 | $2,093 | $106,200 | $26,600 | $79,600 |
| 2017 | $2,342 | $119,000 | $24,950 | $94,050 |
| 2016 | $2,234 | $137,450 | $24,950 | $112,500 |
| 2012 | -- | $96,700 | $10,950 | $85,750 |
Source: Public Records
Map
Nearby Homes
- 1915 Sioux St
- 1106 18th St W
- 1006 Parkway Dr
- 1908 9th Ave W
- 2037 9th Ave W
- 2206 24th St W
- 2309 14th Ave W
- 915 6th Ave NW
- Tbd L1 B9 25th St W
- 1801 15th Ave W
- 1005 27th St W
- 806 27th St W
- 1023 28th St W
- 714 27th St W
- 702 27th St W
- N/A 26th St W
- 2710 7th Ave W
- 709 28th St W
- 815 14th St W
- 1401 6th Ave W