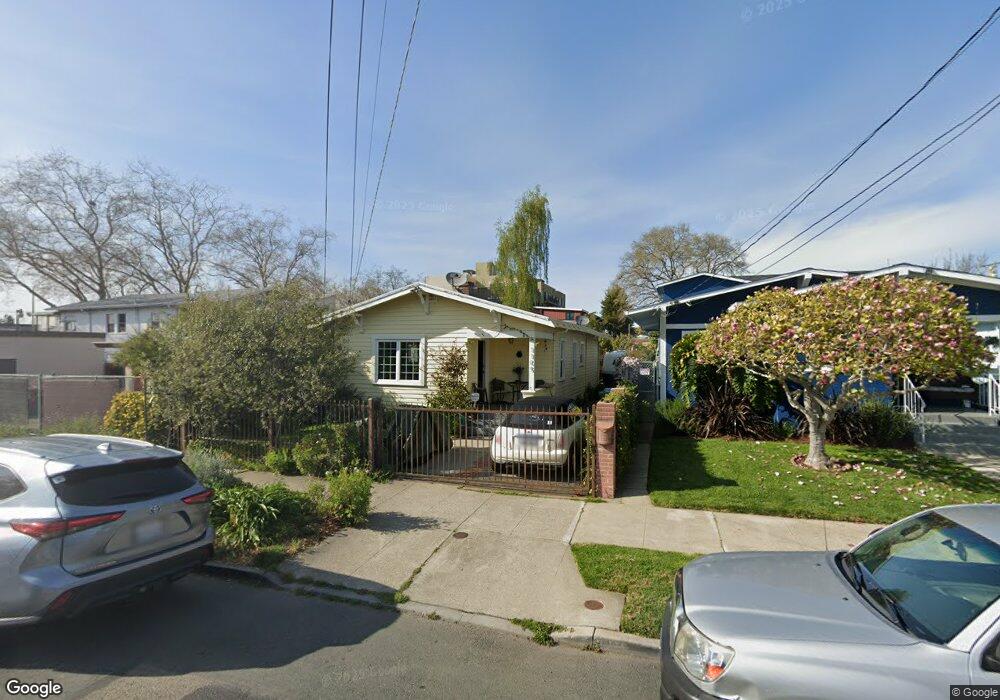
1109 Oregon St Berkeley, CA 94702
West Berkeley NeighborhoodEstimated Value: $808,000 - $1,331,000
2
Beds
1
Bath
670
Sq Ft
$1,630/Sq Ft
Est. Value
About This Home
This home is located at 1109 Oregon St, Berkeley, CA 94702 and is currently estimated at $1,092,073, approximately $1,629 per square foot. 1109 Oregon St is a home located in Alameda County with nearby schools including Malcolm X Elementary School, Oxford Elementary School, and Washington Elementary School.
Ownership History
Date
Name
Owned For
Owner Type
Purchase Details
Closed on
Nov 17, 1999
Sold by
Ascend Residential Properties Inc
Bought by
Ellis Nancy L and Kaspar Patricia A
Current Estimated Value
Home Financials for this Owner
Home Financials are based on the most recent Mortgage that was taken out on this home.
Original Mortgage
$179,450
Outstanding Balance
$55,077
Interest Rate
7.82%
Estimated Equity
$1,036,996
Purchase Details
Closed on
Jun 8, 1999
Sold by
Leonard Duane M
Bought by
Ascend Residential Properties Inc
Purchase Details
Closed on
Sep 14, 1994
Sold by
Salas Virginia
Bought by
Leonard Duane M and 1994 Virginia Salas Revocable
Purchase Details
Closed on
Nov 15, 1993
Sold by
Salas Virginia M and The Estate Of Walter Salas
Bought by
Salas Virginia M
Create a Home Valuation Report for This Property
The Home Valuation Report is an in-depth analysis detailing your home's value as well as a comparison with similar homes in the area
Home Values in the Area
Average Home Value in this Area
Purchase History
| Date | Buyer | Sale Price | Title Company |
|---|---|---|---|
| Ellis Nancy L | $185,000 | First American Title Guarant | |
| Ascend Residential Properties Inc | $132,000 | Fidelity National Title Co | |
| Leonard Duane M | -- | -- | |
| Salas Virginia M | $80,000 | Placer Title Company |
Source: Public Records
Mortgage History
| Date | Status | Borrower | Loan Amount |
|---|---|---|---|
| Open | Ellis Nancy L | $179,450 |
Source: Public Records
Tax History
| Year | Tax Paid | Tax Assessment Tax Assessment Total Assessment is a certain percentage of the fair market value that is determined by local assessors to be the total taxable value of land and additions on the property. | Land | Improvement |
|---|---|---|---|---|
| 2025 | $6,158 | $332,657 | $85,297 | $254,360 |
| 2024 | $6,158 | $325,998 | $83,625 | $249,373 |
| 2023 | $6,017 | $326,469 | $81,985 | $244,484 |
| 2022 | $5,884 | $313,070 | $80,378 | $239,692 |
| 2021 | $5,879 | $306,795 | $78,802 | $234,993 |
| 2020 | $5,516 | $310,580 | $77,995 | $232,585 |
| 2019 | $5,244 | $304,491 | $76,466 | $228,025 |
| 2018 | $5,141 | $298,522 | $74,967 | $223,555 |
| 2017 | $4,934 | $292,670 | $73,497 | $219,173 |
| 2016 | $4,734 | $286,932 | $72,056 | $214,876 |
| 2015 | $4,664 | $282,623 | $70,974 | $211,649 |
| 2014 | $4,617 | $277,088 | $69,584 | $207,504 |
Source: Public Records
Map
Nearby Homes
- 2751 Wallace St
- 1034 Grayson St
- 1010 Grayson St
- 1237 Ashby Ave
- 2717 Mabel St
- 1314 Ashby Ave
- 3032 Mabel St
- 1135 Parker St
- 1080 67th St
- 2922 Stanton St
- 2790 Sacramento St
- 2782 Sacramento St
- 2774 Sacramento St
- 1450 Ward St
- 2758 Sacramento St
- 1118 Dwight Way
- 1142 Dwight Way
- 2750 Sacramento St
- 1144 Dwight Way
- 1092 Dwight Way
- 1115 Oregon St
- 1117 Oregon St
- 2742 Wallace St
- 2815 San Pablo Ave
- 2821 San Pablo Ave
- 2811 San Pablo Ave
- 2738 Wallace St
- 2736 Wallace St
- 1112 Oregon St
- 1201 Oregon St
- 2734 Wallace St
- 1114 Oregon St
- 1116 Oregon St
- 2765 Wallace St
- 1205 Oregon St
- 2730 Wallace St
- 2795 San Pablo Ave
- 2759 Wallace St
- 2728 Wallace St
- 2755 Wallace St
Your Personal Tour Guide
Ask me questions while you tour the home.