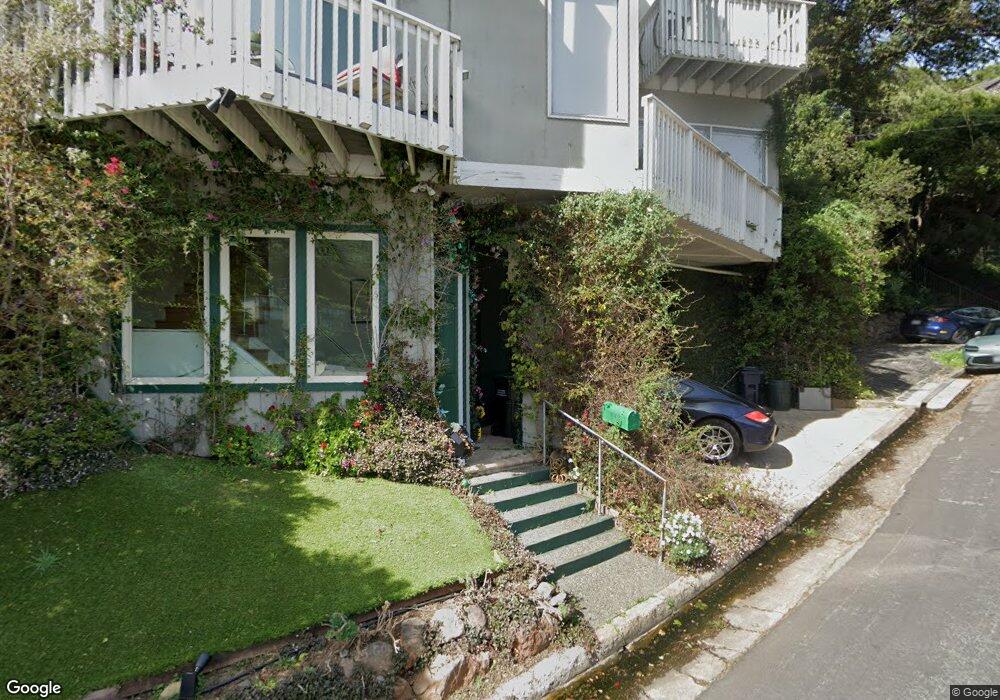
111 Crescent Ave Sausalito, CA 94965
Estimated Value: $2,044,000 - $2,179,000
2
Beds
2
Baths
1,719
Sq Ft
$1,225/Sq Ft
Est. Value
About This Home
This home is located at 111 Crescent Ave, Sausalito, CA 94965 and is currently estimated at $2,105,079, approximately $1,224 per square foot. 111 Crescent Ave is a home located in Marin County with nearby schools including Dr. Martin Luther King, Jr. Academy - Nevada Campus, Tamalpais High School, and The New Village School.
Ownership History
Date
Name
Owned For
Owner Type
Purchase Details
Closed on
Aug 7, 2023
Sold by
Tierney Michael J
Bought by
Ignacio Delcastillo Gustavo
Current Estimated Value
Home Financials for this Owner
Home Financials are based on the most recent Mortgage that was taken out on this home.
Original Mortgage
$300,000
Outstanding Balance
$293,036
Interest Rate
6.71%
Mortgage Type
Seller Take Back
Estimated Equity
$1,812,043
Purchase Details
Closed on
Feb 3, 2012
Sold by
Dunn Andrew M and Shimosaka Douglas M
Bought by
Tierney Michael J
Purchase Details
Closed on
Mar 23, 2008
Sold by
Dunn Andrew M and Shimosaka Douglas M
Bought by
Dunn Andrew M and Shimosaka Douglas M
Create a Home Valuation Report for This Property
The Home Valuation Report is an in-depth analysis detailing your home's value as well as a comparison with similar homes in the area
Home Values in the Area
Average Home Value in this Area
Purchase History
| Date | Buyer | Sale Price | Title Company |
|---|---|---|---|
| Ignacio Delcastillo Gustavo | -- | None Listed On Document | |
| Tierney Michael J | $959,000 | Old Republic Title Company | |
| Dunn Andrew M | -- | None Available |
Source: Public Records
Mortgage History
| Date | Status | Borrower | Loan Amount |
|---|---|---|---|
| Open | Ignacio Delcastillo Gustavo | $300,000 |
Source: Public Records
Tax History
| Year | Tax Paid | Tax Assessment Tax Assessment Total Assessment is a certain percentage of the fair market value that is determined by local assessors to be the total taxable value of land and additions on the property. | Land | Improvement |
|---|---|---|---|---|
| 2025 | $25,691 | $1,989,000 | $1,122,000 | $867,000 |
| 2024 | $24,658 | $1,950,000 | $1,100,000 | $850,000 |
| 2023 | $15,703 | $1,155,318 | $694,157 | $461,161 |
| 2022 | $15,167 | $1,132,666 | $680,547 | $452,119 |
| 2021 | $14,988 | $1,110,464 | $667,207 | $443,257 |
| 2020 | $14,685 | $1,099,085 | $660,370 | $438,715 |
| 2019 | $14,247 | $1,077,543 | $647,427 | $430,116 |
| 2018 | $13,651 | $1,056,421 | $634,736 | $421,685 |
| 2017 | $13,373 | $1,035,712 | $622,293 | $413,419 |
| 2016 | $12,787 | $1,015,405 | $610,092 | $405,313 |
| 2015 | $12,793 | $1,000,160 | $600,932 | $399,228 |
| 2014 | $12,352 | $980,570 | $589,162 | $391,408 |
Source: Public Records
Map
Nearby Homes
- 77 Crescent Ave
- 134 Crescent Ave
- 448 Sausalito Blvd
- 102 Cloud View Rd
- 31 Edwards Ave
- 11 E Pier
- 177 Cazneau Ave
- 621 Nevada St
- 119 Lincoln Dr
- 81 Anchorage Rd
- 46 Cliff Rd
- 10 Cliff Rd
- 125 Belvedere Ave
- 337 Belvedere Ave
- 140 Belvedere Ave
- 445 Belvedere Ave
- 1 Blanding Ln
- 12 S 40 Dock
- 13 S 40 Dock
- 38 S 40 Dock
- 105 Crescent Ave
- 117 Crescent Ave
- 532 Sausalito Blvd
- 528 Sausalito Blvd
- 536 Sausalito Blvd
- 120 Crescent Ave
- 123 Crescent Ave
- 524 Sausalito Blvd
- 112 Crescent Ave
- 103 Crescent Ave
- 122 Crescent Ave
- 540 Sausalito Blvd
- 127 Crescent Ave
- 3 Lower Crescent Ave
- 658 Main St
- 128 Crescent Ave
- 95 Crescent Ave
- 520 Sausalito Blvd
- 654 Main St
- 76 Crescent Ave
Your Personal Tour Guide
Ask me questions while you tour the home.