

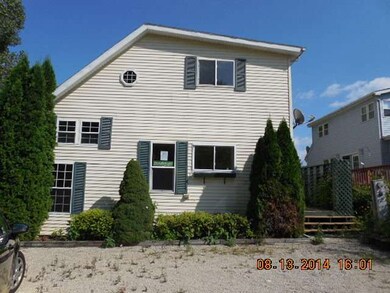
111 Fossil Ridge Rd Wilmington, IL 60481
3
Beds
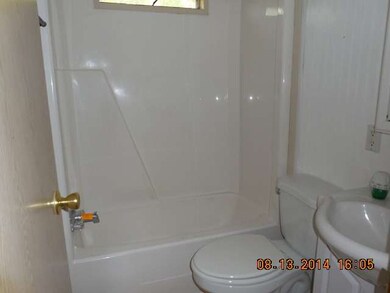
2
Baths
1,700
Sq Ft
4,792
Sq Ft Lot
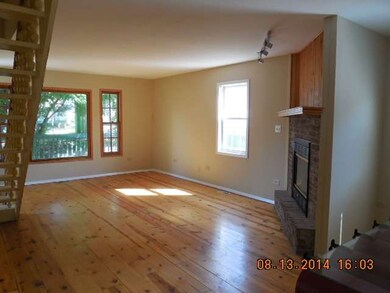
Highlights
- Loft
- Entrance Foyer
- Central Air
About This Home
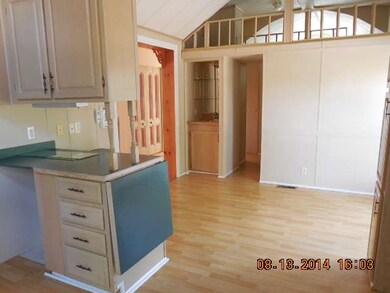
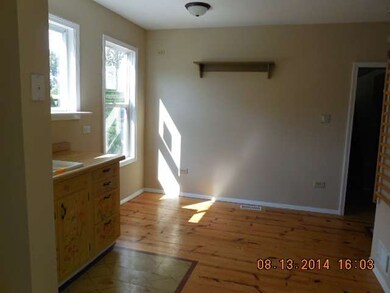
As of July 20163 bedroom, 2 bath single family home that includes carport and directly access to the inner ponds of the subdivision. Property includes 2nd floor master w/private bathrooms and full bath. Rear of home has deck and shed. This is a Fannie Mae Homepath property.
Last Agent to Sell the Property
Wilk Real Estate License #471012010 Listed on: 08/14/2014
Home Details
Home Type
- Single Family
Est. Annual Taxes
- $4,205
Year Built
- 1999
HOA Fees
- $115 per month
Home Design
- Vinyl Siding
Interior Spaces
- Entrance Foyer
- Loft
- Crawl Space
Parking
- Parking Available
- Off-Street Parking
- Parking Space is Owned
Utilities
- Central Air
- Heating System Uses Propane
Listing and Financial Details
- $2,250 Seller Concession
Ownership History
Date
Name
Owned For
Owner Type
Purchase Details
Listed on
Apr 30, 2016
Closed on
Jul 28, 2016
Sold by
Houston Michael P and Houston Tana
Bought by
Gans Steven T and Gans Susan M
Seller's Agent
David Shallow
RE/MAX Professionals Select
Buyer's Agent
David Shallow
RE/MAX Professionals Select
List Price
$158,000
Sold Price
$126,000
Premium/Discount to List
-$32,000
-20.25%
Current Estimated Value
Home Financials for this Owner
Home Financials are based on the most recent Mortgage that was taken out on this home.
Estimated Appreciation
$142,255
Avg. Annual Appreciation
8.20%
Original Mortgage
$123,717
Interest Rate
3.37%
Mortgage Type
FHA
Purchase Details
Listed on
Aug 14, 2014
Closed on
Oct 17, 2015
Sold by
Fannie Mae
Bought by
Houston Michael P
Seller's Agent
Brent Wilk
Wilk Real Estate
Buyer's Agent
David Shallow
RE/MAX Professionals Select
List Price
$90,000
Sold Price
$75,000
Premium/Discount to List
-$15,000
-16.67%
Home Financials for this Owner
Home Financials are based on the most recent Mortgage that was taken out on this home.
Avg. Annual Appreciation
97.91%
Original Mortgage
$73,463
Interest Rate
4.25%
Mortgage Type
FHA
Purchase Details
Closed on
Jun 17, 2014
Sold by
Johnson Robert N and Wells Fargo Bank Na
Bought by
Federal National Mortgage Association
Purchase Details
Closed on
Jan 22, 2014
Sold by
Not Provided
Bought by
Federal National Mortgage Association
Purchase Details
Closed on
Jan 9, 2014
Sold by
Johnson Robert N and Johnson Norma J
Bought by
Wells Fargo Bank Na
Purchase Details
Closed on
Mar 8, 2000
Sold by
Lasalle Bank National Assn
Bought by
Johnson Robert N and Johnson Norma J
Home Financials for this Owner
Home Financials are based on the most recent Mortgage that was taken out on this home.
Original Mortgage
$101,600
Interest Rate
8.27%
Similar Homes in Wilmington, IL
Create a Home Valuation Report for This Property
The Home Valuation Report is an in-depth analysis detailing your home's value as well as a comparison with similar homes in the area
Home Values in the Area
Average Home Value in this Area
Purchase History
| Date | Type | Sale Price | Title Company |
|---|---|---|---|
| Warranty Deed | $126,000 | Attorneys Title Guaranty Fun | |
| Special Warranty Deed | $75,000 | Servicelink Llc | |
| Sheriffs Deed | -- | Premier Title | |
| Trustee Deed | -- | None Available | |
| Sheriffs Deed | $215,172 | None Available | |
| Deed | $22,500 | -- |
Source: Public Records
Mortgage History
| Date | Status | Loan Amount | Loan Type |
|---|---|---|---|
| Open | $123,250 | Closed End Mortgage | |
| Closed | $123,717 | FHA | |
| Previous Owner | $73,463 | FHA | |
| Previous Owner | $186,000 | Unknown | |
| Previous Owner | $20,000 | Credit Line Revolving | |
| Previous Owner | $150,000 | Unknown | |
| Previous Owner | $23,000 | Unknown | |
| Previous Owner | $120,000 | Unknown | |
| Previous Owner | $101,600 | No Value Available |
Source: Public Records
Property History
| Date | Event | Price | Change | Sq Ft Price |
|---|---|---|---|---|
| 07/28/2016 07/28/16 | Sold | $126,000 | -6.7% | $74 / Sq Ft |
| 06/07/2016 06/07/16 | Pending | -- | -- | -- |
| 05/27/2016 05/27/16 | Price Changed | $135,000 | -5.6% | $79 / Sq Ft |
| 05/19/2016 05/19/16 | Price Changed | $143,000 | -3.4% | $84 / Sq Ft |
| 05/10/2016 05/10/16 | Price Changed | $148,000 | -6.3% | $87 / Sq Ft |
| 04/30/2016 04/30/16 | For Sale | $158,000 | +110.7% | $93 / Sq Ft |
| 10/26/2015 10/26/15 | Sold | $75,000 | -16.7% | $44 / Sq Ft |
| 09/08/2015 09/08/15 | Pending | -- | -- | -- |
| 08/13/2015 08/13/15 | Price Changed | $90,000 | 0.0% | $53 / Sq Ft |
| 08/13/2015 08/13/15 | For Sale | $90,000 | +20.0% | $53 / Sq Ft |
| 05/14/2015 05/14/15 | Off Market | $75,000 | -- | -- |
| 05/06/2015 05/06/15 | Price Changed | $107,900 | 0.0% | $63 / Sq Ft |
| 05/06/2015 05/06/15 | For Sale | $107,900 | +43.9% | $63 / Sq Ft |
| 02/18/2015 02/18/15 | Off Market | $75,000 | -- | -- |
| 01/27/2015 01/27/15 | Price Changed | $119,900 | -14.4% | $71 / Sq Ft |
| 12/20/2014 12/20/14 | Price Changed | $140,000 | -1.8% | $82 / Sq Ft |
| 11/19/2014 11/19/14 | Price Changed | $142,500 | -4.9% | $84 / Sq Ft |
| 10/18/2014 10/18/14 | Price Changed | $149,900 | -6.3% | $88 / Sq Ft |
| 09/17/2014 09/17/14 | Price Changed | $159,900 | -5.6% | $94 / Sq Ft |
| 08/14/2014 08/14/14 | For Sale | $169,400 | -- | $100 / Sq Ft |
Source: Midwest Real Estate Data (MRED)
Tax History Compared to Growth
Tax History
| Year | Tax Paid | Tax Assessment Tax Assessment Total Assessment is a certain percentage of the fair market value that is determined by local assessors to be the total taxable value of land and additions on the property. | Land | Improvement |
|---|---|---|---|---|
| 2023 | $4,205 | $63,461 | $10,252 | $53,209 |
| 2022 | $3,556 | $57,587 | $9,303 | $48,284 |
| 2021 | $3,436 | $54,965 | $8,879 | $46,086 |
| 2020 | $3,247 | $52,075 | $8,412 | $43,663 |
| 2019 | $3,054 | $49,173 | $7,943 | $41,230 |
| 2018 | $2,930 | $47,056 | $7,601 | $39,455 |
| 2017 | $2,872 | $46,133 | $7,452 | $38,681 |
| 2016 | $2,792 | $44,616 | $7,207 | $37,409 |
| 2015 | $2,330 | $43,464 | $7,021 | $36,443 |
| 2014 | $2,330 | $43,464 | $7,021 | $36,443 |
| 2013 | $2,330 | $46,486 | $7,509 | $38,977 |
Source: Public Records
Agents Affiliated with this Home
-
David Shallow
Seller's Agent in 2016
David Shallow
RE/MAX
(630) 615-2870
288 Total Sales
-
Brent Wilk
Seller's Agent in 2015
Brent Wilk
Wilk Real Estate
(312) 968-2358
4 in this area
677 Total Sales
Map
Source: Midwest Real Estate Data (MRED)
MLS Number: MRD08703208
APN: 24-04-154-006
Disclaimer: Certain information contained herein is derived from information provided by parties other than Homes.com. All information provided is deemed reliable, but is not guaranteed to be accurate and should be independently verified.
![]() Based on information submitted to the MLS GRID. All data is obtained from various sources and may not have been verified by broker or MLS GRID. Supplied Open House Information is subject to change without notice. All information should be independently reviewed and verified for accuracy. Properties may or may not be listed by the office/agent presenting the information. Some IDX listings have been excluded from this website.
Based on information submitted to the MLS GRID. All data is obtained from various sources and may not have been verified by broker or MLS GRID. Supplied Open House Information is subject to change without notice. All information should be independently reviewed and verified for accuracy. Properties may or may not be listed by the office/agent presenting the information. Some IDX listings have been excluded from this website.
The Digital Millennium Copyright Act of 1998, 17 U.S.C. § 512 (the “DMCA”) provides recourse for copyright owners who believe that material appearing on the Internet infringes their rights under U.S. copyright law. If you believe in good faith that any content or material made available in connection with our website or services infringes your copyright, you (or your agent) may send us a notice requesting that the content or material be removed, or access to it blocked.
Notices must be sent in writing by email to DMCAnotice@MLSGrid.com.
The DMCA requires that your notice of alleged copyright infringement include the following information:
(1) description of the copyrighted work that is the subject of claimed infringement;
(2) description of the alleged infringing content and information sufficient to permit us to locate the content;
(3) contact information for you, including your address, telephone number and email address;
(4) a statement by you that you have a good faith belief that the content in the manner complained of is not authorized by the copyright owner, or its agent, or by the operation of any law;
(5) a statement by you, signed under penalty of perjury, that the information in the notification is accurate and that you have the authority to enforce the copyrights that are claimed to be infringed; and
(6) a physical or electronic signature of the copyright owner or a person authorized to act on the copyright owner’s behalf. Failure to include all of the above information may result in the delay of the processing of your complaint.
Nearby Homes
- 96 Fossil Ridge Rd
- 68 Fossil Cove Ln
- 59 Fossil Ridge Ct
- 36 Hole in The Wall Ct
- 140 Fossil Lake Ct
- 132 Fossil Lake Rd
- 195 Fossil Cove Ln
- 183 Fossil Cove Ct
- 184 Eon Ln
- 268 Fossil Bay Ct
- 220 Fossil Cove Ln
- 77 Dinosaur Rd
- 79 Dinosaur Rd
- 82 Dinosaur Rd
- 41 Dinosaur Rd
- 130 Tully Rd
- 75 Largemouth Ln
- 72 Largemouth Ln
- 30 Aspen Ln
- 64 Big Musky Circle Ln