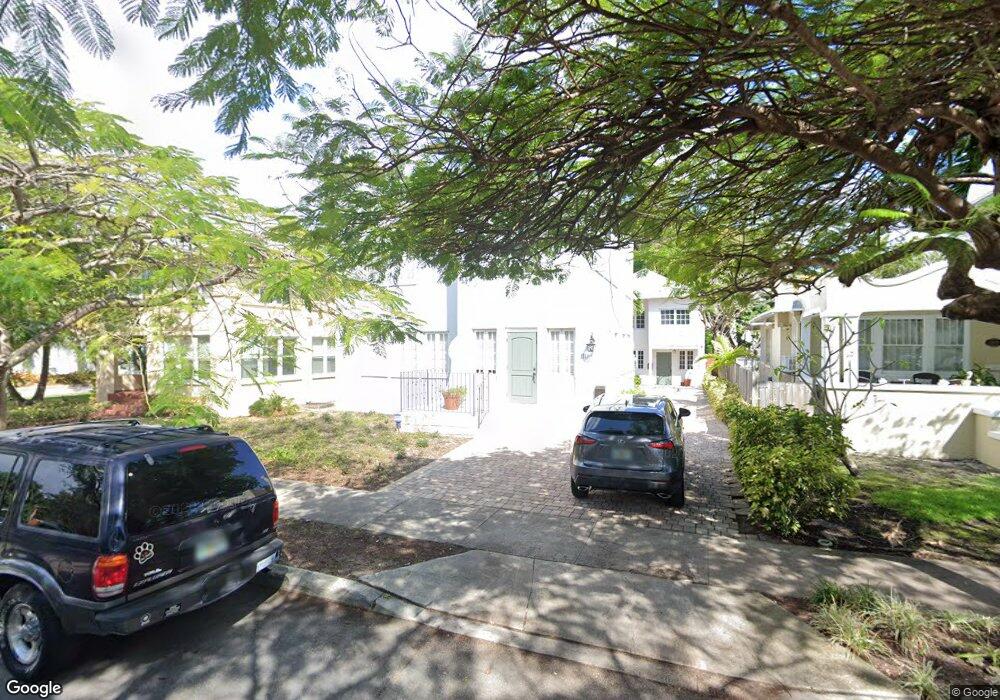
111 NE 43rd St Miami, FL 33137
Miami Design District NeighborhoodEstimated Value: $1,514,350 - $2,225,000
6
Beds
5
Baths
3,246
Sq Ft
$554/Sq Ft
Est. Value
About This Home
This home is located at 111 NE 43rd St, Miami, FL 33137 and is currently estimated at $1,797,838, approximately $553 per square foot. 111 NE 43rd St is a home located in Miami-Dade County with nearby schools including Toussaint L'Ouverture Elementary, Jose De Diego Middle School, and Booker T. Washington Senior High School.
Ownership History
Date
Name
Owned For
Owner Type
Purchase Details
Closed on
Sep 21, 2023
Sold by
San Jose Christopher C and San Jose Janeliz
Bought by
Easylnvest 9 Llc
Current Estimated Value
Purchase Details
Closed on
Mar 15, 2022
Sold by
111 Ne 43 Street Llc
Bought by
San Jose Christopher C and San Jose Janeliz
Home Financials for this Owner
Home Financials are based on the most recent Mortgage that was taken out on this home.
Original Mortgage
$1,485,000
Interest Rate
2.88%
Mortgage Type
New Conventional
Purchase Details
Closed on
May 3, 2017
Sold by
Thriving Investments Llc
Bought by
111 Ne 43 Street Llc
Purchase Details
Closed on
Apr 13, 2016
Sold by
Chao Anthony
Bought by
Thriving Investments Llc
Purchase Details
Closed on
May 19, 2015
Sold by
Chao Anthony
Bought by
Thriving Investments Llc
Purchase Details
Closed on
Mar 25, 2003
Sold by
Harrison Marshall Curtis and Harrison Stephanie
Bought by
Chao Anthony
Create a Home Valuation Report for This Property
The Home Valuation Report is an in-depth analysis detailing your home's value as well as a comparison with similar homes in the area
Home Values in the Area
Average Home Value in this Area
Purchase History
| Date | Buyer | Sale Price | Title Company |
|---|---|---|---|
| Easylnvest 9 Llc | $1,700,000 | Riva Title | |
| Easylnvest 9 Llc | $1,700,000 | Riva Title | |
| San Jose Christopher C | $1,650,000 | Roland J Martinez Pa | |
| 111 Ne 43 Street Llc | -- | Attorney | |
| Thriving Investments Llc | $313,000 | None Available | |
| Thriving Investments Llc | $313,000 | None Available | |
| Chao Anthony | $145,000 | -- |
Source: Public Records
Mortgage History
| Date | Status | Borrower | Loan Amount |
|---|---|---|---|
| Previous Owner | San Jose Christopher C | $1,485,000 |
Source: Public Records
Tax History Compared to Growth
Tax History
| Year | Tax Paid | Tax Assessment Tax Assessment Total Assessment is a certain percentage of the fair market value that is determined by local assessors to be the total taxable value of land and additions on the property. | Land | Improvement |
|---|---|---|---|---|
| 2025 | $23,722 | $825,638 | $551,250 | $274,388 |
| 2024 | $24,450 | $1,146,213 | $603,530 | $542,683 |
| 2023 | $24,450 | $1,152,422 | $603,530 | $548,892 |
| 2022 | $14,233 | $585,751 | $0 | $0 |
| 2021 | $12,074 | $532,501 | $252,096 | $280,405 |
| 2020 | $13,058 | $577,414 | $294,834 | $282,580 |
| 2019 | $13,132 | $579,591 | $294,834 | $284,757 |
| 2018 | $11,076 | $492,532 | $294,834 | $197,698 |
| 2017 | $9,562 | $379,642 | $0 | $0 |
| 2016 | $11,106 | $439,198 | $0 | $0 |
| 2015 | $7,815 | $227,857 | $0 | $0 |
| 2014 | $6,625 | $207,143 | $0 | $0 |
Source: Public Records
Map
Nearby Homes
- 151 NE 43rd St
- 46 NE 43rd St
- 135 NE 45th St
- 2 NE 44th St
- 231 NE 43rd St
- 2 NE 45th St
- 85 NE 46th St
- 261 NE 43rd St
- 4500 N Miami Ave
- 146 NE 47th St
- 4444 N Miami Ave
- 4510 N Miami Ave
- 11 NW 45th St
- 260 NE 46th St
- 4848/4860 N Miami Ave
- 43 NW 41st St
- 4727 NE 1st Ct
- 4250 Biscayne Blvd Unit 1112
- 4250 Biscayne Blvd Unit 1211
- 4250 Biscayne Blvd Unit 1008
- 111 NE 43rd St
- 111 NE 43rd St Unit R
- 101 NE 43rd St
- 126 NE 43rd St
- 119 NE 43rd St
- 127 NE 43rd St
- 120 NE 44th St
- 100 NE 43rd St
- 122 NE 43rd St
- 135 NE 43rd St
- 130 NE 44th St
- 4300 NE 1st Ave
- 136 NE 43rd St
- 136 NE 43rd St Unit A34
- 136 NE 43rd St
- 90 NE 43rd St
- 136 NE 44th St Unit Rear
- 136 NE 44th St
- 143 NE 43rd St Unit 1
- 143 NE 43rd St Unit 6