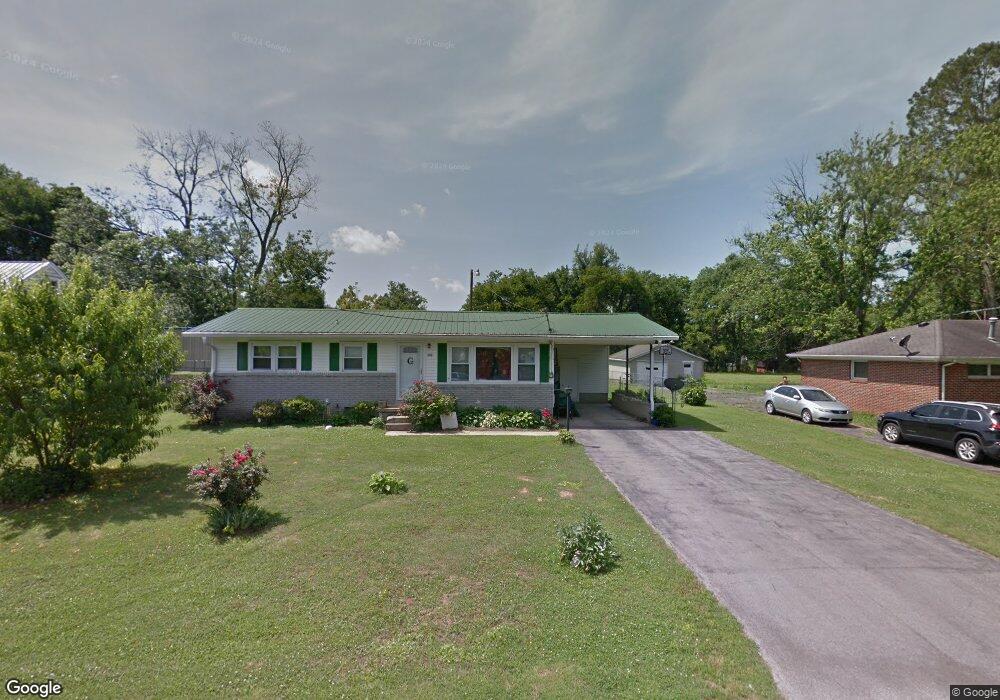
111 Pickle St Shelbyville, TN 37160
Estimated Value: $174,772 - $224,000
--
Bed
2
Baths
1,025
Sq Ft
$188/Sq Ft
Est. Value
About This Home
This home is located at 111 Pickle St, Shelbyville, TN 37160 and is currently estimated at $193,193, approximately $188 per square foot. 111 Pickle St is a home located in Bedford County with nearby schools including South Side Elementary School, Harris Middle School, and Christian Chapel Academy.
Ownership History
Date
Name
Owned For
Owner Type
Purchase Details
Closed on
Feb 5, 2015
Sold by
Bolden Andrea
Bought by
Griffy Cindy
Current Estimated Value
Purchase Details
Closed on
Oct 15, 2004
Sold by
Holt Fred J
Bought by
Troupe Mildred
Purchase Details
Closed on
Sep 12, 2000
Sold by
Roche John
Bought by
Holt Fred J Trust
Purchase Details
Closed on
Dec 30, 1999
Sold by
Utz Jack and Utz Mary
Bought by
Canter Keith E
Purchase Details
Closed on
Jan 13, 1999
Sold by
Crowell Mary Lee
Bought by
Utz Jack and Utz Mary
Purchase Details
Closed on
Jul 25, 1997
Sold by
Crowell Mary Lee
Bought by
Ledding Crystal N
Purchase Details
Closed on
Aug 20, 1987
Bought by
Crowell Mary Lee
Purchase Details
Closed on
Jun 1, 1961
Bought by
Marsh Herbert and Nay Dean
Create a Home Valuation Report for This Property
The Home Valuation Report is an in-depth analysis detailing your home's value as well as a comparison with similar homes in the area
Home Values in the Area
Average Home Value in this Area
Purchase History
| Date | Buyer | Sale Price | Title Company |
|---|---|---|---|
| Griffy Cindy | -- | -- | |
| Troupe Mildred | $61,070 | -- | |
| Holt Fred J Trust | $59,000 | -- | |
| Canter Keith E | $58,850 | -- | |
| Utz Jack | $52,000 | -- | |
| Ledding Crystal N | $36,000 | -- | |
| Crowell Mary Lee | -- | -- | |
| Marsh Herbert | -- | -- |
Source: Public Records
Tax History Compared to Growth
Tax History
| Year | Tax Paid | Tax Assessment Tax Assessment Total Assessment is a certain percentage of the fair market value that is determined by local assessors to be the total taxable value of land and additions on the property. | Land | Improvement |
|---|---|---|---|---|
| 2025 | -- | $26,650 | $0 | $0 |
| 2024 | -- | $26,650 | $6,600 | $20,050 |
| 2023 | $1,014 | $26,650 | $6,600 | $20,050 |
| 2022 | $1,044 | $26,650 | $6,600 | $20,050 |
| 2021 | $948 | $26,650 | $6,600 | $20,050 |
| 2020 | $734 | $26,650 | $6,600 | $20,050 |
| 2019 | $734 | $16,575 | $3,250 | $13,325 |
| 2018 | $717 | $16,575 | $3,250 | $13,325 |
| 2017 | $717 | $16,575 | $3,250 | $13,325 |
| 2016 | $711 | $16,575 | $3,250 | $13,325 |
| 2015 | $711 | $16,575 | $3,250 | $13,325 |
| 2014 | $654 | $16,694 | $0 | $0 |
Source: Public Records
Map
Nearby Homes