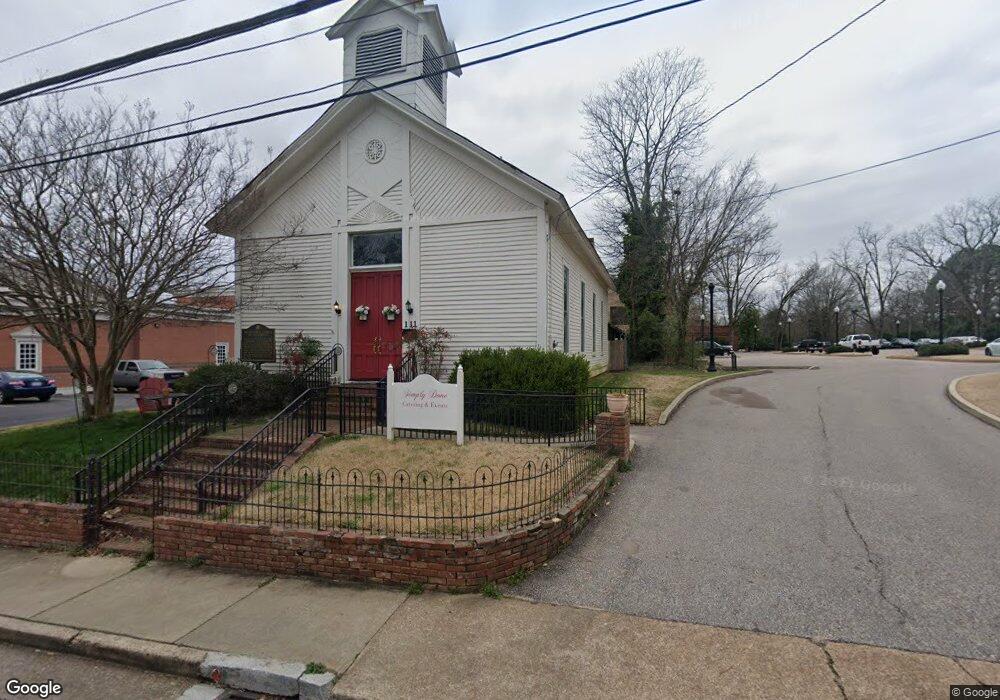
111 Walnut St Collierville, TN 38017
Estimated Value: $223,441
Studio
--
Bath
1,680
Sq Ft
$133/Sq Ft
Est. Value
About This Home
This home is located at 111 Walnut St, Collierville, TN 38017 and is currently estimated at $223,441, approximately $133 per square foot. 111 Walnut St is a home located in Shelby County with nearby schools including Collierville Elementary School, Collierville Middle School, and Collierville High School.
Ownership History
Date
Name
Owned For
Owner Type
Purchase Details
Closed on
Nov 15, 2024
Sold by
Ashworth Patricia J
Bought by
E & B Realty Llc
Current Estimated Value
Home Financials for this Owner
Home Financials are based on the most recent Mortgage that was taken out on this home.
Original Mortgage
$180,000
Outstanding Balance
$148,256
Interest Rate
6.12%
Mortgage Type
New Conventional
Estimated Equity
$75,185
Purchase Details
Closed on
Nov 3, 2017
Sold by
Ashworth Patricia J
Bought by
Ashworth Patricia J
Purchase Details
Closed on
May 12, 2008
Sold by
Cox Herman Wright
Bought by
Ashworth John W
Purchase Details
Closed on
Aug 18, 2003
Sold by
Cox Herman Wright
Bought by
Cox Herman Wright
Purchase Details
Closed on
Nov 7, 2001
Sold by
Cox Herman Wright
Bought by
Cox Herman Wright and Herman Wright Cox Jr Living Trust
Create a Home Valuation Report for This Property
The Home Valuation Report is an in-depth analysis detailing your home's value as well as a comparison with similar homes in the area
Home Values in the Area
Average Home Value in this Area
Purchase History
| Date | Buyer | Sale Price | Title Company |
|---|---|---|---|
| E & B Realty Llc | $225,000 | Mid South Title Services | |
| Ashworth Patricia J | -- | None Available | |
| Ashworth John W | $280,000 | Mid South Title Services Llc | |
| Cox Herman Wright | -- | -- | |
| Cox Cynthia M | -- | -- | |
| Cox Grandchildrens Trust #1 | -- | -- | |
| Cox Herman Wright | -- | -- | |
| Cox Herman Wright | -- | -- |
Source: Public Records
Mortgage History
| Date | Status | Borrower | Loan Amount |
|---|---|---|---|
| Open | E & B Realty Llc | $180,000 |
Source: Public Records
Tax History
| Year | Tax Paid | Tax Assessment Tax Assessment Total Assessment is a certain percentage of the fair market value that is determined by local assessors to be the total taxable value of land and additions on the property. | Land | Improvement |
|---|---|---|---|---|
| 2025 | $3,503 | $107,440 | $12,960 | $94,480 |
| 2024 | $3,503 | $103,320 | $8,000 | $95,320 |
| 2023 | $5,404 | $103,320 | $8,000 | $95,320 |
| 2022 | $5,280 | $103,320 | $8,000 | $95,320 |
| 2021 | $5,342 | $103,320 | $8,000 | $95,320 |
| 2020 | $5,548 | $94,360 | $8,000 | $86,360 |
| 2019 | $3,822 | $94,360 | $8,000 | $86,360 |
| 2018 | $3,822 | $94,360 | $8,000 | $86,360 |
| 2017 | $3,878 | $94,360 | $8,000 | $86,360 |
| 2016 | $3,463 | $79,240 | $0 | $0 |
| 2014 | $3,463 | $79,240 | $0 | $0 |
Source: Public Records
Map
Nearby Homes
- 110 W Poplar Ave
- 232 W Poplar Ave
- 279 W Poplar Ave
- 277 Peterson Lake Rd
- 281 Briarbrook Cove
- 127 Dannon Springs Dr
- 255 Andrew Way Rd
- 262 E Poplar Ave
- 289 Harris St
- 289 E Poplar Ave
- 255 Ellawood Ln
- 275 Ellawood Ln
- 354 Distribution Pkwy
- 358 Wolf Trap Rd
- 125 Keough Rd
- 396 N Main St
- 431 Peterson Lake Rd
- 466 Mockingbird Ln
- 487 Highway 72
- 407 S Main Extension
- 1917 Other
- 120 Walnut St
- 126 Walnut St
- 109 N Center St
- 103 N Center St
- 134 Walnut St
- 99 N Center St
- 168 N Rowlett St
- 101 N Center St
- 101 N Center St Unit Springs
- 102 E Mulberry St
- 142 Walnut St
- 180 N Rowlett St
- 110 E Mulberry St
- 159 College St
- 152 Walnut St
- 114 E Mulberry St
- 161 S Rowlett St
- 116 E Mulberry St
- 118 E Mulberry St
Your Personal Tour Guide
Ask me questions while you tour the home.