Estimated Value: $215,626 - $287,000
3
Beds
2
Baths
1,591
Sq Ft
$152/Sq Ft
Est. Value
About This Home
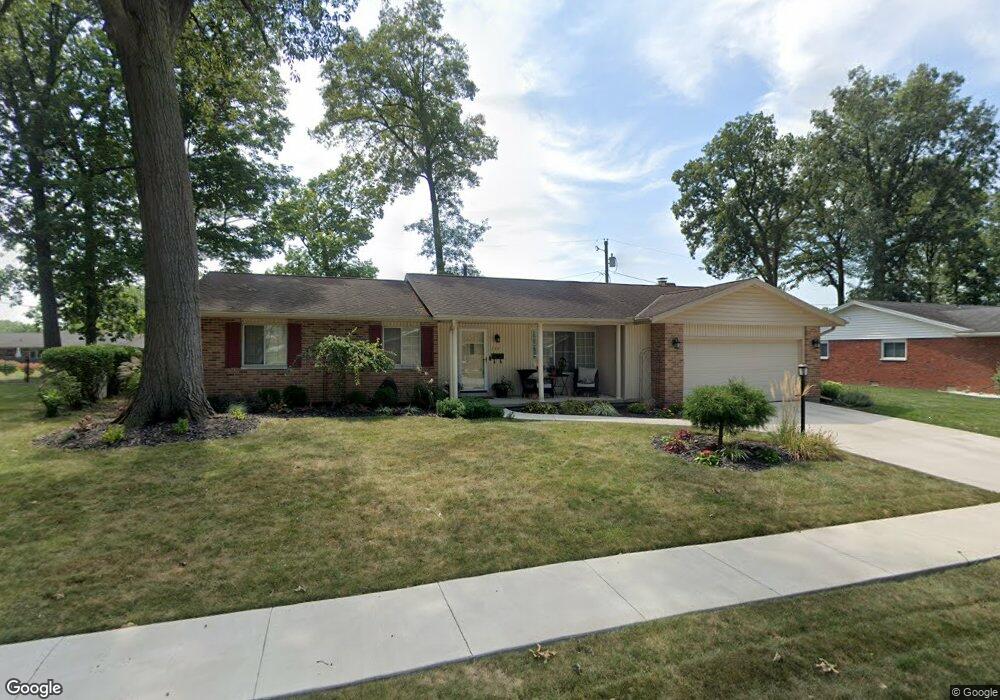
This home is located at 111 Yorkshire Cir, Lima, OH 45804 and is currently estimated at $242,157, approximately $152 per square foot. 111 Yorkshire Cir is a home located in Allen County with nearby schools including Bath Elementary School, Bath Middle School, and Bath High School.
Ownership History
Date
Name
Owned For
Owner Type
Purchase Details
Closed on
Sep 21, 2021
Sold by
Rose Lana V
Bought by
Rose Lana V and Lehman Keith J
Current Estimated Value
Home Financials for this Owner
Home Financials are based on the most recent Mortgage that was taken out on this home.
Original Mortgage
$93,000
Outstanding Balance
$64,939
Interest Rate
2.8%
Mortgage Type
Stand Alone Refi Refinance Of Original Loan
Estimated Equity
$177,218
Purchase Details
Closed on
Jul 12, 2007
Sold by
Graham Ercil Dean and Graham Ercil D
Bought by
Rose Lana
Home Financials for this Owner
Home Financials are based on the most recent Mortgage that was taken out on this home.
Original Mortgage
$106,500
Interest Rate
6.42%
Mortgage Type
New Conventional
Purchase Details
Closed on
Mar 16, 1993
Sold by
Calim Bruce A
Bought by
Graham Ercil D
Purchase Details
Closed on
Mar 11, 1988
Bought by
Calim Bruce A
Create a Home Valuation Report for This Property
The Home Valuation Report is an in-depth analysis detailing your home's value as well as a comparison with similar homes in the area
Purchase History
| Date | Buyer | Sale Price | Title Company |
|---|---|---|---|
| Rose Lana V | -- | None Available | |
| Rose Lana | $114,000 | None Available | |
| Graham Ercil D | $80,000 | -- | |
| Calim Bruce A | $74,500 | -- |
Source: Public Records
Mortgage History
| Date | Status | Borrower | Loan Amount |
|---|---|---|---|
| Open | Rose Lana V | $93,000 | |
| Closed | Rose Lana | $106,500 |
Source: Public Records
Tax History
| Year | Tax Paid | Tax Assessment Tax Assessment Total Assessment is a certain percentage of the fair market value that is determined by local assessors to be the total taxable value of land and additions on the property. | Land | Improvement |
|---|---|---|---|---|
| 2024 | $2,459 | $56,080 | $9,560 | $46,520 |
| 2023 | $2,148 | $47,500 | $8,090 | $39,410 |
| 2022 | $2,174 | $47,500 | $8,090 | $39,410 |
| 2021 | $2,179 | $47,500 | $8,090 | $39,410 |
| 2020 | $2,042 | $40,750 | $7,670 | $33,080 |
| 2019 | $2,042 | $40,750 | $7,670 | $33,080 |
| 2018 | $1,997 | $40,750 | $7,670 | $33,080 |
| 2017 | $1,781 | $36,440 | $7,670 | $28,770 |
| 2016 | $1,775 | $36,440 | $7,670 | $28,770 |
| 2015 | $1,749 | $36,440 | $7,670 | $28,770 |
| 2014 | $1,749 | $34,870 | $7,670 | $27,200 |
| 2013 | $1,809 | $34,870 | $7,670 | $27,200 |
Source: Public Records
Map
Nearby Homes
- 120 Barnsbury Dr
- 108 Valley Way
- 127 Cheshire Cir
- 314 Devonshire Dr
- 468 Sunnymeade Ln
- 819 Canyon Dr
- 2525 Harding Hwy
- 712 Radcliffe St
- 307 Ridge Crest Cir
- 2223 Makin Dr
- 1800 Reservoir Rd Unit Lot 51
- 573 Waterview Cir
- 32 Lakeside Dr
- 591 Lakeridge Dr
- 3746 Armstead Place
- 595 Lakeridge Dr
- 737 Lakeridge Dr
- 3774 Mount Vernon Place Unit C
- 304 Pinewood Cir
- 3833 Harding Hwy
Your Personal Tour Guide
Ask me questions while you tour the home.