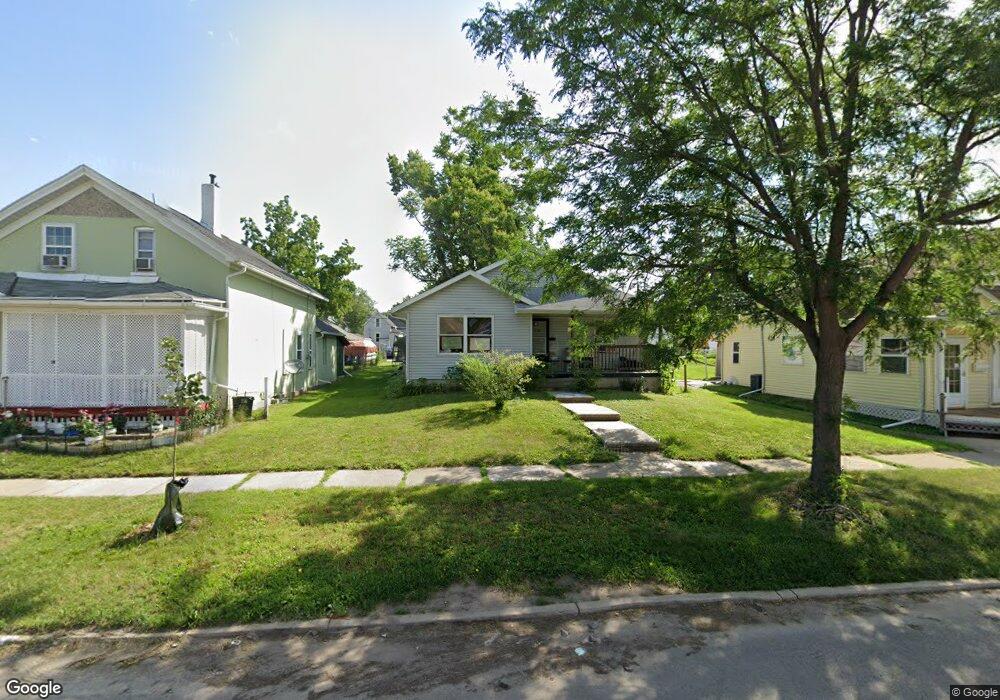
1110 7th St SE Cedar Rapids, IA 52401
Oak Hill Jackson NeighborhoodEstimated Value: $156,000 - $194,000
3
Beds
1
Bath
1,195
Sq Ft
$146/Sq Ft
Est. Value
About This Home
This home is located at 1110 7th St SE, Cedar Rapids, IA 52401 and is currently estimated at $173,933, approximately $145 per square foot. 1110 7th St SE is a home located in Linn County with nearby schools including Grant Wood Elementary School, Summit Elementary School, and McKinley STEAM Academy.
Ownership History
Date
Name
Owned For
Owner Type
Purchase Details
Closed on
Apr 19, 2007
Sold by
Beserra Donna M and Beserra Ralph
Bought by
Mally Selina M
Current Estimated Value
Home Financials for this Owner
Home Financials are based on the most recent Mortgage that was taken out on this home.
Original Mortgage
$82,875
Outstanding Balance
$50,191
Interest Rate
6.18%
Mortgage Type
Purchase Money Mortgage
Estimated Equity
$123,742
Purchase Details
Closed on
May 24, 2000
Sold by
Midamerica Housing Partnership
Bought by
Al Suleiman Salah M and Al Suleiman Donna M
Home Financials for this Owner
Home Financials are based on the most recent Mortgage that was taken out on this home.
Original Mortgage
$63,000
Interest Rate
8.25%
Create a Home Valuation Report for This Property
The Home Valuation Report is an in-depth analysis detailing your home's value as well as a comparison with similar homes in the area
Home Values in the Area
Average Home Value in this Area
Purchase History
| Date | Buyer | Sale Price | Title Company |
|---|---|---|---|
| Mally Selina M | $86,000 | None Available | |
| Al Suleiman Salah M | $72,000 | -- |
Source: Public Records
Mortgage History
| Date | Status | Borrower | Loan Amount |
|---|---|---|---|
| Open | Mally Selina M | $82,875 | |
| Previous Owner | Al Suleiman Salah M | $63,000 | |
| Closed | Al Suleiman Salah M | $8,500 |
Source: Public Records
Tax History Compared to Growth
Tax History
| Year | Tax Paid | Tax Assessment Tax Assessment Total Assessment is a certain percentage of the fair market value that is determined by local assessors to be the total taxable value of land and additions on the property. | Land | Improvement |
|---|---|---|---|---|
| 2025 | $2,350 | $168,100 | $29,000 | $139,100 |
| 2024 | $361 | $108,400 | $24,400 | $84,000 |
| 2023 | $361 | $132,800 | $24,400 | $108,400 |
| 2022 | $2,352 | $120,900 | $27,800 | $93,100 |
| 2021 | $2,266 | $122,500 | $23,200 | $99,300 |
| 2020 | $2,266 | $111,300 | $9,300 | $102,000 |
| 2019 | $2,148 | $108,200 | $9,300 | $98,900 |
| 2018 | $2,086 | $108,200 | $9,300 | $98,900 |
| 2017 | $2,197 | $110,400 | $9,300 | $101,100 |
| 2016 | $2,197 | $103,400 | $7,900 | $95,500 |
| 2015 | $2,105 | $98,934 | $7,888 | $91,046 |
| 2014 | $1,920 | $98,934 | $7,888 | $91,046 |
| 2013 | $1,874 | $98,934 | $7,888 | $91,046 |
Source: Public Records
Map
Nearby Homes
- 1021 9th St SE
- 1007 10th St SE
- 329 12th Ave SE
- 905 3rd St SE Unit 305
- 905 3rd St SE Unit 304
- 1721 Americus Dr SE
- 1506 8th Ave SE
- Lot 42 Kestrel Heights
- 1737 14th Ave SE
- 809 17th St SE
- 728 4th Ave SE
- 317 8th St SE
- 1612 7th Ave SE
- 520 15th St SE
- 1828 Mount Vernon Rd SE
- 1713 7th Ave SE
- 1522 6th Ave SE
- 400 1st St SE Unit 410
- 1269 4th Ave SE
- 513 17th St SE
- 1116 7th St SE
- 1106 7th St SE
- 1122 7th St SE
- 1100 7th St SE
- 1126 7th St SE
- 719 11th Ave SE
- 1111 8th St SE
- 1117 8th St SE
- 1107 8th St SE
- 1119 8th St SE
- 1105 8th St SE
- 1123 8th St SE
- 1113 8th St SE
- 1103 7th St SE
- 1113 7th St SE
- 1107 7th St SE
- 1119 7th St SE
- 1127 8th St SE
- 624 12th Ave SE
- 720 11th Ave SE