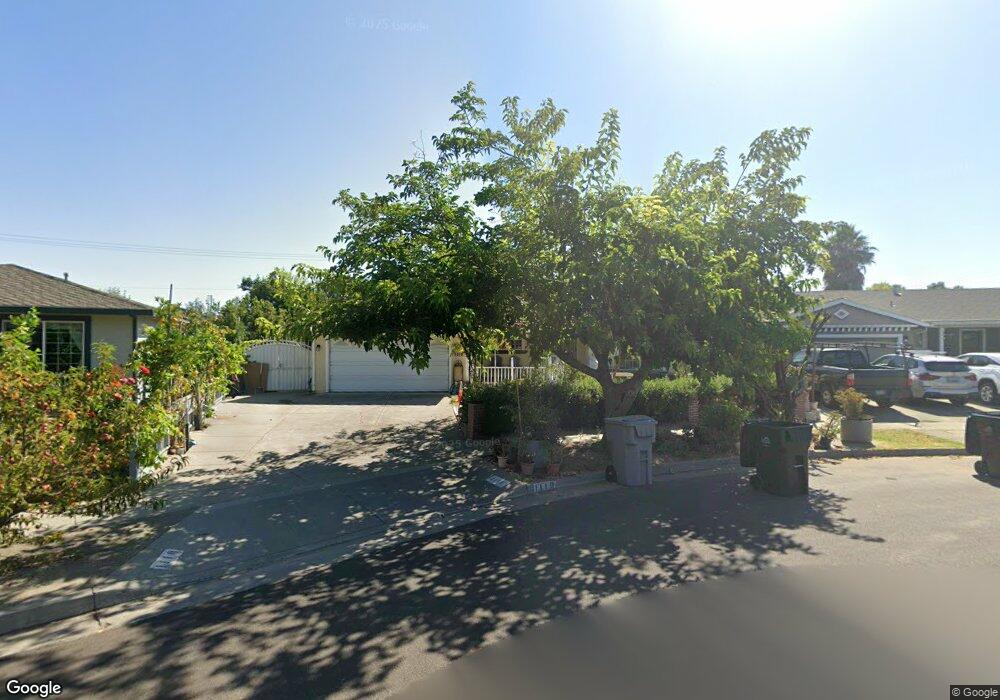
1110 Drexel Way San Jose, CA 95121
Stonegate NeighborhoodEstimated Value: $1,232,058 - $1,448,000
4
Beds
2
Baths
1,703
Sq Ft
$793/Sq Ft
Est. Value
About This Home
This home is located at 1110 Drexel Way, San Jose, CA 95121 and is currently estimated at $1,350,265, approximately $792 per square foot. 1110 Drexel Way is a home located in Santa Clara County with nearby schools including Stonegate Elementary School, Sylvandale Middle School, and Yerba Buena High School.
Ownership History
Date
Name
Owned For
Owner Type
Purchase Details
Closed on
Nov 3, 2009
Sold by
Deutsche Bank National Trust Company
Bought by
Dang Ngoc Hong
Current Estimated Value
Home Financials for this Owner
Home Financials are based on the most recent Mortgage that was taken out on this home.
Original Mortgage
$352,000
Outstanding Balance
$229,724
Interest Rate
4.99%
Mortgage Type
New Conventional
Estimated Equity
$1,120,541
Purchase Details
Closed on
Jul 21, 2009
Sold by
Mertz Elvira
Bought by
Deutsche Bank National Trust Company
Purchase Details
Closed on
Nov 19, 2007
Sold by
Mertz Elvira
Bought by
Mertz Elvira M
Purchase Details
Closed on
Jun 2, 2005
Sold by
Corpuz Deanna L
Bought by
Mertz Elvira
Home Financials for this Owner
Home Financials are based on the most recent Mortgage that was taken out on this home.
Original Mortgage
$562,500
Interest Rate
7.98%
Mortgage Type
Fannie Mae Freddie Mac
Purchase Details
Closed on
May 13, 2005
Sold by
Corpuz Deanna L
Bought by
Corpuz Deanna L
Home Financials for this Owner
Home Financials are based on the most recent Mortgage that was taken out on this home.
Original Mortgage
$562,500
Interest Rate
7.98%
Mortgage Type
Fannie Mae Freddie Mac
Purchase Details
Closed on
Feb 9, 2005
Sold by
Corpuz Deanna L
Bought by
Corpuz Deanna L
Home Financials for this Owner
Home Financials are based on the most recent Mortgage that was taken out on this home.
Original Mortgage
$351,000
Interest Rate
5.79%
Mortgage Type
New Conventional
Purchase Details
Closed on
Jun 26, 2001
Sold by
Corpuz Deanna L
Bought by
Corpuz Deanna L
Home Financials for this Owner
Home Financials are based on the most recent Mortgage that was taken out on this home.
Original Mortgage
$311,000
Interest Rate
7.37%
Purchase Details
Closed on
Jun 4, 2001
Sold by
Ngo Kevin Dien Xuan
Bought by
Corpuz Deanna L
Home Financials for this Owner
Home Financials are based on the most recent Mortgage that was taken out on this home.
Original Mortgage
$311,000
Interest Rate
7.37%
Purchase Details
Closed on
Feb 13, 1998
Sold by
Ly Ngo and Nguyen Kim L
Bought by
Ngo Kevin Dien Xuan
Home Financials for this Owner
Home Financials are based on the most recent Mortgage that was taken out on this home.
Original Mortgage
$165,000
Interest Rate
6.97%
Purchase Details
Closed on
Dec 14, 1996
Sold by
Ly Ngo and Nguyen Kim L
Bought by
Ngo Ly and Nguyen Kim Loan
Create a Home Valuation Report for This Property
The Home Valuation Report is an in-depth analysis detailing your home's value as well as a comparison with similar homes in the area
Home Values in the Area
Average Home Value in this Area
Purchase History
| Date | Buyer | Sale Price | Title Company |
|---|---|---|---|
| Dang Ngoc Hong | $440,000 | Chicago Title Co | |
| Deutsche Bank National Trust Company | $355,289 | Fidelity Natl Title Ins Co | |
| Mertz Elvira M | -- | None Available | |
| Mertz Elvira | $625,000 | First American Title Company | |
| Corpuz Deanna L | -- | -- | |
| Corpuz Deanna L | -- | First American Title Company | |
| Corpuz Deanna L | -- | First American Title Company | |
| Corpuz Deanna L | -- | Chicago Title Co | |
| Corpuz Deanna L | $436,000 | Chicago Title Co | |
| Corpuz Deanna L | -- | Chicago Title Co | |
| Ngo Kevin Dien Xuan | $82,500 | Golden California Title Co | |
| Ngo Ly | -- | -- |
Source: Public Records
Mortgage History
| Date | Status | Borrower | Loan Amount |
|---|---|---|---|
| Open | Dang Ngoc Hong | $352,000 | |
| Previous Owner | Mertz Elvira | $562,500 | |
| Previous Owner | Corpuz Deanna L | $351,000 | |
| Previous Owner | Corpuz Deanna L | $311,000 | |
| Previous Owner | Ngo Kevin Dien Xuan | $165,000 |
Source: Public Records
Tax History Compared to Growth
Tax History
| Year | Tax Paid | Tax Assessment Tax Assessment Total Assessment is a certain percentage of the fair market value that is determined by local assessors to be the total taxable value of land and additions on the property. | Land | Improvement |
|---|---|---|---|---|
| 2025 | $8,641 | $567,948 | $340,770 | $227,178 |
| 2024 | $8,641 | $556,813 | $334,089 | $222,724 |
| 2023 | $8,523 | $545,896 | $327,539 | $218,357 |
| 2022 | $8,337 | $535,193 | $321,117 | $214,076 |
| 2021 | $8,290 | $524,700 | $314,821 | $209,879 |
| 2020 | $8,008 | $519,320 | $311,593 | $207,727 |
| 2019 | $7,681 | $509,138 | $305,484 | $203,654 |
| 2018 | $7,670 | $499,156 | $299,495 | $199,661 |
| 2017 | $7,569 | $489,370 | $293,623 | $195,747 |
| 2016 | $7,196 | $479,775 | $287,866 | $191,909 |
| 2015 | $7,048 | $472,569 | $283,542 | $189,027 |
| 2014 | $6,567 | $463,313 | $277,988 | $185,325 |
Source: Public Records
Map
Nearby Homes
- 2566 Boren Dr
- 1051 Keldon Dr
- 2697 Lone Bluff Way
- 3016 Shadow Springs Place Unit 113
- 677 Dadis Way
- 2416 Balme Dr
- 653 Dadis Way
- 1058 Tekman Dr Unit 58
- 3241 Shadow Park Place
- 2580 Senter Rd Unit 455
- 2580 Senter Rd Unit 515
- 608 Balfour Dr
- 2681 Senter Rd
- 2570 Senter Rd
- 3326 Shadow Park Place
- 3354 Shadow Park Place Unit 319
- 2855 Senter Rd Unit 1
- 2855 Senter Rd Unit 30
- 2855 Senter Rd Unit 84
- 2855 Senter Rd Unit 10
- 1118 Drexel Way
- 1102 Drexel Way
- 2743 Mclaughlin Ave
- 2735 Mclaughlin Ave
- 1124 Drexel Way
- 1094 Drexel Way
- 2747 Mclaughlin Ave
- 2731 Mclaughlin Ave
- 1091 Drexel Way
- 1090 Drexel Way
- 1139 Bellingham Dr
- 1145 Bellingham Dr
- 1133 Bellingham Dr
- 1116 Cheswick Dr
- 1087 Drexel Way
- 1127 Bellingham Dr
- 1086 Drexel Way
- 1121 Bellingham Dr
- 1110 Cheswick Dr
- 2738 Mclaughlin Ave