1110 E 17th Ave Unit 112 Columbus, OH 43211
South Linden NeighborhoodEstimated Value: $196,000 - $250,000
6
Beds
2
Baths
3,450
Sq Ft
$66/Sq Ft
Est. Value
About This Home
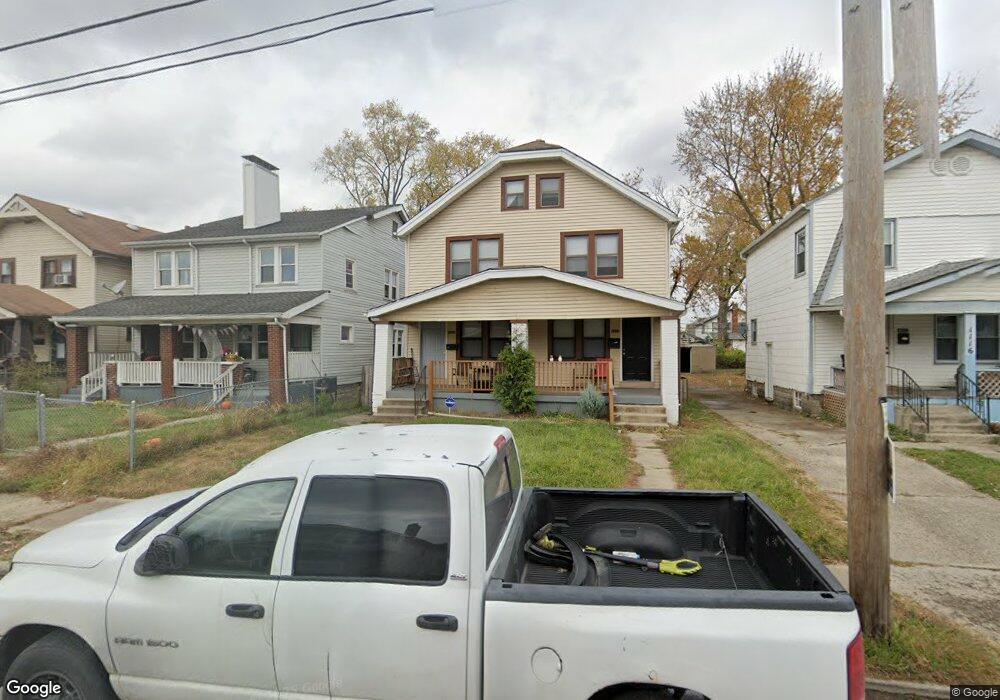
This home is located at 1110 E 17th Ave Unit 112, Columbus, OH 43211 and is currently estimated at $226,247, approximately $65 per square foot. 1110 E 17th Ave Unit 112 is a home located in Franklin County with nearby schools including Windsor Stem Acadmey, Linden-Mckinley Stem School On Arcadia, and North Columbus Preparatory Academy.
Ownership History
Date
Name
Owned For
Owner Type
Purchase Details
Closed on
Dec 4, 2018
Sold by
City Of Columbus Ohio Municipal Corpor
Bought by
Espinoza Otilia Elizabeth
Current Estimated Value
Purchase Details
Closed on
Nov 26, 2018
Sold by
Central Ohio Community Improvement Corpo
Bought by
City Of Columbus
Purchase Details
Closed on
Jan 11, 2018
Sold by
Ricketts Robert
Bought by
1944Dd Inc
Purchase Details
Closed on
Dec 7, 2017
Sold by
Oneness Investment Fund Management Corp
Bought by
Central Ohio Community Improvement Corp
Purchase Details
Closed on
Jun 30, 2014
Sold by
Tucker Minnie and Harris Minnie
Bought by
Oneness Investment Fund Management Corp
Purchase Details
Closed on
Dec 20, 1973
Bought by
Harris Minnie
Create a Home Valuation Report for This Property
The Home Valuation Report is an in-depth analysis detailing your home's value as well as a comparison with similar homes in the area
Home Values in the Area
Average Home Value in this Area
Purchase History
| Date | Buyer | Sale Price | Title Company |
|---|---|---|---|
| Espinoza Otilia Elizabeth | -- | None Available | |
| City Of Columbus | -- | None Available | |
| 1944Dd Inc | -- | None Available | |
| Central Ohio Community Improvement Corp | -- | None Available | |
| Oneness Investment Fund Management Corp | $54,000 | None Available | |
| Harris Minnie | -- | -- |
Source: Public Records
Tax History Compared to Growth
Tax History
| Year | Tax Paid | Tax Assessment Tax Assessment Total Assessment is a certain percentage of the fair market value that is determined by local assessors to be the total taxable value of land and additions on the property. | Land | Improvement |
|---|---|---|---|---|
| 2024 | $3,802 | $82,960 | $5,150 | $77,810 |
| 2023 | $3,754 | $82,950 | $5,145 | $77,805 |
| 2022 | $1,217 | $22,900 | $2,490 | $20,410 |
| 2021 | $1,219 | $22,900 | $2,490 | $20,410 |
| 2020 | $1,221 | $22,900 | $2,490 | $20,410 |
| 2019 | $1,186 | $19,080 | $2,070 | $17,010 |
| 2018 | $1,246 | $19,080 | $2,070 | $17,010 |
| 2017 | $3,996 | $19,080 | $2,070 | $17,010 |
| 2016 | $3,034 | $16,560 | $2,380 | $14,180 |
| 2015 | $1,621 | $16,560 | $2,380 | $14,180 |
| 2014 | $1,027 | $16,560 | $2,380 | $14,180 |
| 2013 | $901 | $18,375 | $2,625 | $15,750 |
Source: Public Records
Map
Nearby Homes
- 1082-1084 E 17th Ave
- 1094 E 16th Ave
- 1661 Cleveland Ave Unit 1659
- 1074 E 15th Ave
- 982 E 16th Ave
- 1273-1275 E 18th Ave
- 1136 E 21st Ave
- 1109 Windsor Ave Unit 1103
- 1287 E 19th Ave
- 1111 Windsor Ave
- 1292 E 17th Ave
- 1121 Windsor Ave
- 1288-1292 E 19th Ave
- 975 E 14th Ave
- 1088 E 21st Ave
- 1249-1251 E 15th Ave
- 1161 E 22nd Ave Unit 1159
- 0 E 18th Ave
- 1033 E 22nd Ave
- 972 E 12th Ave
- 1110 E 17th Ave Unit 12
- 1106-1108 E 17th Ave
- 1106 E 17th Ave Unit 108
- 1116 E 17th Ave
- 1122 E 17th Ave
- 1102 E 17th Ave
- 1126 E 17th Ave Unit 128
- 1098 E 17th Ave
- 1098 E 17th Ave Unit H
- 1094 E 17th Ave
- 1119 E 18th Ave Unit 121
- 1119 E 18th Ave Unit 21
- 1123 E 18th Ave
- 1115 E 18th Ave
- 1115 E 18th Ave
- 1127 E 18th Ave Unit 129
- 1127-1129 E 18th Ave
- 1088 E 17th Ave
- 1109 E 18th Ave Unit 111
- 1109-1111 E 18th Ave