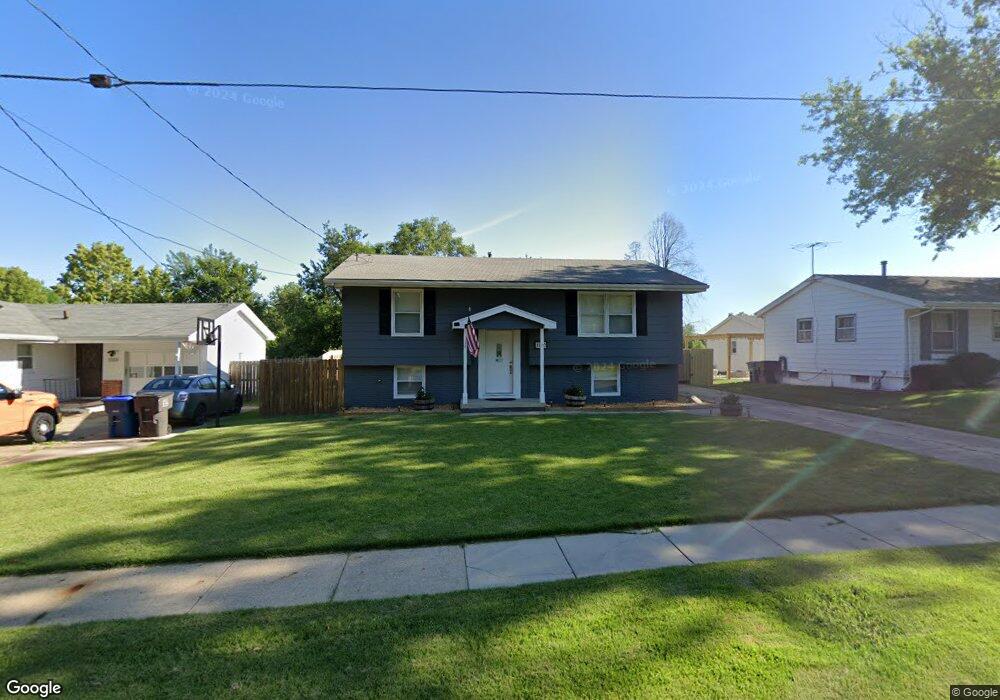
1110 E Thornton Ave Des Moines, IA 50315
South Central DSM NeighborhoodEstimated Value: $206,000 - $233,000
3
Beds
1
Bath
930
Sq Ft
$234/Sq Ft
Est. Value
About This Home
This home is located at 1110 E Thornton Ave, Des Moines, IA 50315 and is currently estimated at $217,831, approximately $234 per square foot. 1110 E Thornton Ave is a home located in Polk County with nearby schools including Howe Elementary School, Weeks Middle School, and Lincoln High School.
Ownership History
Date
Name
Owned For
Owner Type
Purchase Details
Closed on
Jul 26, 2022
Sold by
Daniel R Rice Revocable Trust
Bought by
Rice-West Danelle
Current Estimated Value
Purchase Details
Closed on
Oct 23, 2018
Sold by
Rice Daniel
Bought by
Daniel R Rice Revocable Trust
Purchase Details
Closed on
Sep 21, 2015
Sold by
Rhapsody Holdings Llc
Bought by
Rice Daniel
Purchase Details
Closed on
Aug 10, 2015
Sold by
Compound Interest Llc
Bought by
Rhapsody Holdings Llc
Purchase Details
Closed on
Jul 17, 2015
Sold by
Endress William Gene and Rice Daniel
Bought by
Compound Interest Llc
Purchase Details
Closed on
Dec 17, 2013
Sold by
Dearden Brian
Bought by
Rice Daniel
Purchase Details
Closed on
Aug 5, 2013
Sold by
Rice Daniel
Bought by
Endress William Gene
Purchase Details
Closed on
Sep 9, 2009
Sold by
Chiesa Ronald J and Chiesa Mary Lynn
Bought by
Dearden Brian
Create a Home Valuation Report for This Property
The Home Valuation Report is an in-depth analysis detailing your home's value as well as a comparison with similar homes in the area
Home Values in the Area
Average Home Value in this Area
Purchase History
| Date | Buyer | Sale Price | Title Company |
|---|---|---|---|
| Rice-West Danelle | -- | None Listed On Document | |
| Daniel R Rice Revocable Trust | -- | None Available | |
| Rice Daniel | -- | None Available | |
| Rhapsody Holdings Llc | $135,000 | Attorney | |
| Compound Interest Llc | $2,954 | Attorney | |
| Rice Daniel | -- | None Available | |
| Endress William Gene | $138,000 | None Available | |
| Dearden Brian | $90,500 | None Available |
Source: Public Records
Mortgage History
| Date | Status | Borrower | Loan Amount |
|---|---|---|---|
| Closed | Endress William Gene | $0 |
Source: Public Records
Tax History
| Year | Tax Paid | Tax Assessment Tax Assessment Total Assessment is a certain percentage of the fair market value that is determined by local assessors to be the total taxable value of land and additions on the property. | Land | Improvement |
|---|---|---|---|---|
| 2025 | $3,878 | $217,400 | $35,500 | $181,900 |
| 2024 | $3,878 | $197,100 | $31,600 | $165,500 |
| 2023 | $3,816 | $197,100 | $31,600 | $165,500 |
| 2022 | $3,786 | $161,900 | $26,900 | $135,000 |
| 2021 | $3,668 | $161,900 | $26,900 | $135,000 |
| 2020 | $3,810 | $147,000 | $24,400 | $122,600 |
| 2019 | $3,604 | $147,000 | $24,400 | $122,600 |
| 2018 | $3,568 | $134,100 | $21,700 | $112,400 |
| 2017 | $3,294 | $134,100 | $21,700 | $112,400 |
| 2016 | $3,210 | $121,800 | $19,500 | $102,300 |
| 2015 | $3,210 | $121,800 | $19,500 | $102,300 |
| 2014 | $3,208 | $120,700 | $18,900 | $101,800 |
Source: Public Records
Map
Nearby Homes
- 3136 SE 8th St
- 705 E Watrous Ave
- 1437 E Pleasant View Dr
- 1600 Evergreen Ave
- 4309 SE 10th St
- 3912 SE 5th St
- 1626 Evergreen Ave
- 3140 SE 5th St
- 4280 SE 15th Ct
- 608 E Virginia Ave
- 3218 SE 4th Ct
- 2825 SE 14th St Unit 40
- 2825 SE 14th St Unit 33
- 2825 SE 14th St Unit 58
- 2825 SE 14th St Unit 23
- 2825 SE 14th St Unit 28
- 2830 SE 7th St
- 1440 E Glenwood Dr
- 318 Fleetwood Dr
- 3520 SE 3rd St
- 1116 E Thornton Ave
- 1200 E Thornton Ave
- 3617 SE 11th St
- 3621 SE 11th St
- 3700 SE 12th St
- 1204 E Thornton Ave
- 3613 SE 11th St
- 3701 SE 11th St
- 3706 SE 12th St
- 3609 SE 11th St
- 1210 E Thornton Ave
- 1203 E Thornton Ave
- 3707 SE 11th St
- 1016 E Thornton Ave
- 3707 SE 12th St
- 3710 SE 12th St
- 1214 E Thornton Ave
- 3616 SE 11th St
- 3616 SE 11th St
- 3711 SE 11th St
Your Personal Tour Guide
Ask me questions while you tour the home.