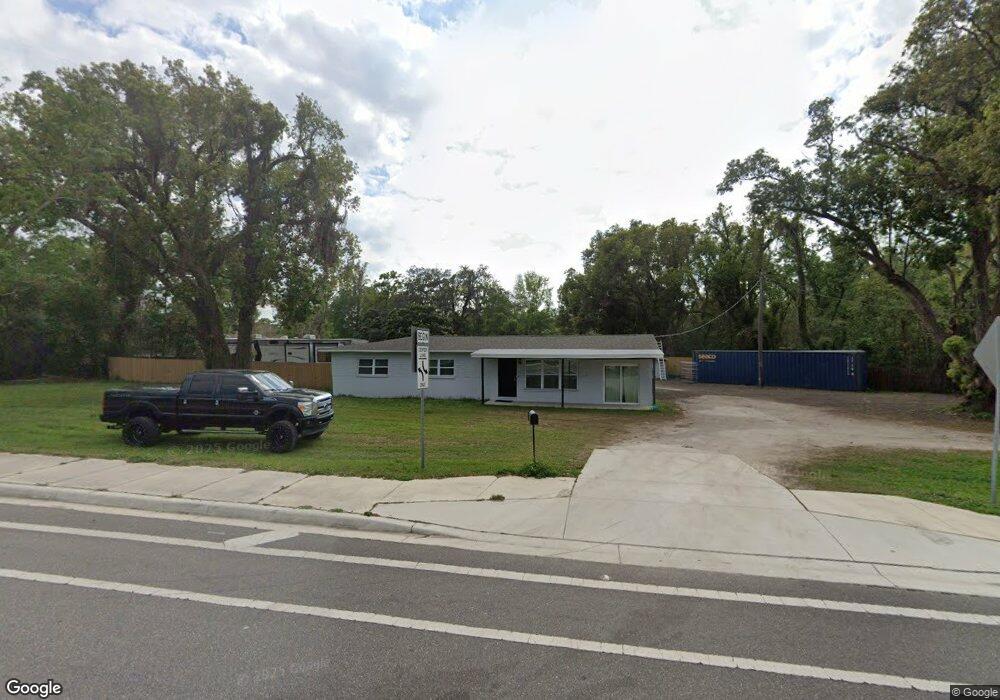
1110 Lithia Pinecrest Rd Brandon, FL 33511
Estimated Value: $355,000 - $426,000
4
Beds
2
Baths
2,006
Sq Ft
$193/Sq Ft
Est. Value
About This Home
This home is located at 1110 Lithia Pinecrest Rd, Brandon, FL 33511 and is currently estimated at $387,720, approximately $193 per square foot. 1110 Lithia Pinecrest Rd is a home located in Hillsborough County with nearby schools including Brooker Elementary School, Burns Middle School, and Bloomingdale High School.
Ownership History
Date
Name
Owned For
Owner Type
Purchase Details
Closed on
Apr 14, 2022
Sold by
Eva D Weathers 2004 Trust
Bought by
Lithia Oz Properties Llc
Current Estimated Value
Home Financials for this Owner
Home Financials are based on the most recent Mortgage that was taken out on this home.
Original Mortgage
$280,500
Outstanding Balance
$260,153
Interest Rate
3.76%
Mortgage Type
New Conventional
Estimated Equity
$127,567
Purchase Details
Closed on
Mar 25, 2021
Sold by
Weathers Eva D
Bought by
Weathers Eva D and The Eva D Weathers 2004 Trust
Purchase Details
Closed on
Aug 20, 2020
Sold by
Weathers Ryan J
Bought by
Weathers Eva D
Purchase Details
Closed on
Jan 10, 2005
Sold by
Edwards Daniel C
Bought by
Weathers Eva D and Baker Brandon
Home Financials for this Owner
Home Financials are based on the most recent Mortgage that was taken out on this home.
Original Mortgage
$176,000
Interest Rate
5.61%
Mortgage Type
Unknown
Purchase Details
Closed on
Aug 26, 2003
Sold by
Shaffer Clarice Patricia
Bought by
Edwards Daniel C
Home Financials for this Owner
Home Financials are based on the most recent Mortgage that was taken out on this home.
Original Mortgage
$108,000
Interest Rate
5.72%
Mortgage Type
Unknown
Create a Home Valuation Report for This Property
The Home Valuation Report is an in-depth analysis detailing your home's value as well as a comparison with similar homes in the area
Home Values in the Area
Average Home Value in this Area
Purchase History
| Date | Buyer | Sale Price | Title Company |
|---|---|---|---|
| Lithia Oz Properties Llc | $330,000 | South Land Title | |
| Weathers Eva D | -- | None Available | |
| Weathers Eva D | $24,000 | None Available | |
| Weathers Eva D | $220,000 | Southland Title Company | |
| Edwards Daniel C | $135,000 | United Southern Title |
Source: Public Records
Mortgage History
| Date | Status | Borrower | Loan Amount |
|---|---|---|---|
| Open | Lithia Oz Properties Llc | $280,500 | |
| Previous Owner | Weathers Eva D | $176,000 | |
| Previous Owner | Edwards Daniel C | $108,000 |
Source: Public Records
Tax History
| Year | Tax Paid | Tax Assessment Tax Assessment Total Assessment is a certain percentage of the fair market value that is determined by local assessors to be the total taxable value of land and additions on the property. | Land | Improvement |
|---|---|---|---|---|
| 2025 | $5,310 | $278,189 | $102,769 | $175,420 |
| 2024 | $5,310 | $273,741 | $95,918 | $177,823 |
| 2023 | $5,487 | $285,409 | $88,088 | $197,321 |
| 2022 | $4,237 | $241,269 | $73,406 | $167,863 |
| 2021 | $3,786 | $187,485 | $60,682 | $126,803 |
| 2020 | $3,588 | $178,628 | $58,236 | $120,392 |
| 2019 | $3,315 | $168,072 | $52,852 | $115,220 |
| 2018 | $3,114 | $162,881 | $0 | $0 |
| 2017 | $2,826 | $139,738 | $0 | $0 |
| 2016 | $2,653 | $122,612 | $0 | $0 |
| 2015 | $2,416 | $111,147 | $0 | $0 |
| 2014 | $2,329 | $106,855 | $0 | $0 |
| 2013 | -- | $118,253 | $0 | $0 |
Source: Public Records
Map
Nearby Homes
- 1111 Durant Rd
- 1101 Durant Rd
- 928 Valmar St
- 1106 Hummingbird Ln
- 913 Helena Dr
- 950 Terra Vista St
- 703 E Lumsden Rd
- 811 Sandcastle Cir
- 1539 Highcrest Cir
- 905 Bama Rd
- 1105 Sweet Breeze Dr
- 1609 Oakmont Dr
- 1614 Berkshire Dr
- 1109 Orangewalk Dr
- 808 Vittorio Place
- 604 Julie Ln
- 1409 Bryan Rd
- 1001 Sonesta Ave
- 803 Bills Cir
- 606 Bama Rd
- 1200 Lithia Pinecrest Rd
- 1111 Lithia Pinecrest Rd
- 1106 Lithia Pinecrest Rd
- 1001 Sunshine Ave
- 1305 Bell Shoals Rd
- 1107 Lithia Pinecrest Rd
- 1202 Lithia Pinecrest Rd
- 1201 Lithia Pinecrest Rd
- 1105 Lithia Pinecrest Rd
- 1005 Sunshine Ave
- 1102 Lithia Pinecrest Rd
- 1103 Lithia Pinecrest Rd
- 1101 Lithia Pinecrest Rd
- 1309 Bell Shoals Rd
- 1002 Sunshine Ave
- 1115 Lithia Pinecrest Rd
- 1207 Bell Shoals Rd
- 1208 Lithia Pinecrest Rd
- 1004 Sunshine Ave
- 1007 Sunshine Ave
Your Personal Tour Guide
Ask me questions while you tour the home.