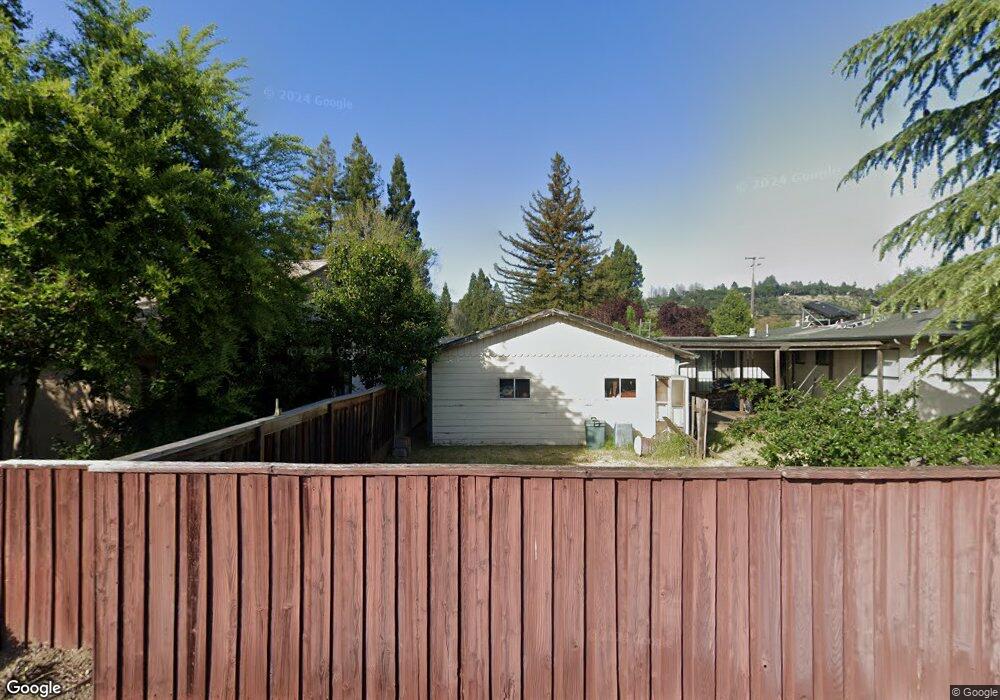
1110 Peppertree Cir Saint Helena, CA 94574
Estimated Value: $721,798 - $784,000
2
Beds
2
Baths
1,170
Sq Ft
$637/Sq Ft
Est. Value
About This Home
This home is located at 1110 Peppertree Cir, Saint Helena, CA 94574 and is currently estimated at $744,950, approximately $636 per square foot. 1110 Peppertree Cir is a home located in Napa County with nearby schools including Saint Helena Elementary School, Saint Helena Primary School, and Robert Louis Stevenson Intermediate School.
Ownership History
Date
Name
Owned For
Owner Type
Purchase Details
Closed on
Nov 4, 2022
Sold by
Klein Family Trust
Bought by
Leann Williams Trust
Current Estimated Value
Purchase Details
Closed on
Mar 8, 2007
Sold by
Klein Martin R and Klein Terrie S
Bought by
Klein Martin Roy and Klein Terrie S
Home Financials for this Owner
Home Financials are based on the most recent Mortgage that was taken out on this home.
Original Mortgage
$90,000
Interest Rate
6.11%
Mortgage Type
New Conventional
Purchase Details
Closed on
Jan 26, 2007
Sold by
Klein Martin R and Klein Terrie S
Bought by
Klein Martin R and Klein Terrie S
Home Financials for this Owner
Home Financials are based on the most recent Mortgage that was taken out on this home.
Original Mortgage
$90,000
Interest Rate
6.11%
Mortgage Type
New Conventional
Purchase Details
Closed on
May 2, 2000
Sold by
Klein Martin Roy and Klein Terrie Simpson
Bought by
Benet Aimee Cregier
Create a Home Valuation Report for This Property
The Home Valuation Report is an in-depth analysis detailing your home's value as well as a comparison with similar homes in the area
Home Values in the Area
Average Home Value in this Area
Purchase History
| Date | Buyer | Sale Price | Title Company |
|---|---|---|---|
| Leann Williams Trust | -- | -- | |
| Klein Martin Roy | -- | None Available | |
| Klein Martin R | -- | Napa Land Title Company | |
| Benet Aimee Cregier | -- | -- |
Source: Public Records
Mortgage History
| Date | Status | Borrower | Loan Amount |
|---|---|---|---|
| Previous Owner | Klein Martin R | $90,000 |
Source: Public Records
Tax History
| Year | Tax Paid | Tax Assessment Tax Assessment Total Assessment is a certain percentage of the fair market value that is determined by local assessors to be the total taxable value of land and additions on the property. | Land | Improvement |
|---|---|---|---|---|
| 2025 | $7,765 | $726,927 | $318,362 | $408,565 |
| 2024 | $7,613 | $712,674 | $312,120 | $400,554 |
| 2023 | $7,613 | $698,700 | $306,000 | $392,700 |
| 2022 | $2,243 | $216,600 | $88,405 | $128,195 |
| 2021 | $2,211 | $212,354 | $86,672 | $125,682 |
| 2020 | $2,187 | $210,178 | $85,784 | $124,394 |
| 2019 | $2,148 | $206,057 | $84,102 | $121,955 |
| 2018 | $2,112 | $202,017 | $82,453 | $119,564 |
| 2017 | $2,071 | $198,057 | $80,837 | $117,220 |
| 2016 | $2,015 | $194,174 | $79,252 | $114,922 |
| 2015 | $1,998 | $191,258 | $78,062 | $113,196 |
| 2014 | $1,977 | $187,512 | $76,533 | $110,979 |
Source: Public Records
Map
Nearby Homes
- 56 Laguna Seca Ct
- 760 Granada Ct
- 49 Laguna Seca Ct
- 201 Silverado Trail N
- 12 Del Rio Ct
- 806 Chiles Ave
- 1700 Howell Mountain Rd
- 844 Signorelli Cir
- 1356 Monte Vista Ave
- 921 Chiles Ave
- 1017 Charter Oak Ave
- 1123 Oak Ave
- 1250 Oakwood Ln
- 1503 Tainter St
- 1330 Pine St
- 1551 Silverado Trail N Unit 34
- 1242 Madrona Ave
- 1467 Kearney St
- 1530 Voorhees Cir
- 1209 Stockton St
- 1100 Peppertree Cir
- 1120 Peppertree Cir
- 12 Del Monte Ct Unit 12
- 14 Del Monte Ct
- 11 Del Monte Ct Unit 11
- 456 Pope St
- 1140 Peppertree Cir
- 1115 Peppertree Cir
- 17 San Lucas Ct Unit 17
- 1125 Peppertree Cir
- 1150 Peppertree Cir
- 1135 Peppertree Cir
- 18 San Lucas Ct
- 1145 Peppertree Cir
- 1160 Peppertree Cir
- 19 San Lucas Ct Unit 19
- 15 San Lucas Ct
- 1155 Peppertree Cir
- 1170 Peppertree Cir
Your Personal Tour Guide
Ask me questions while you tour the home.