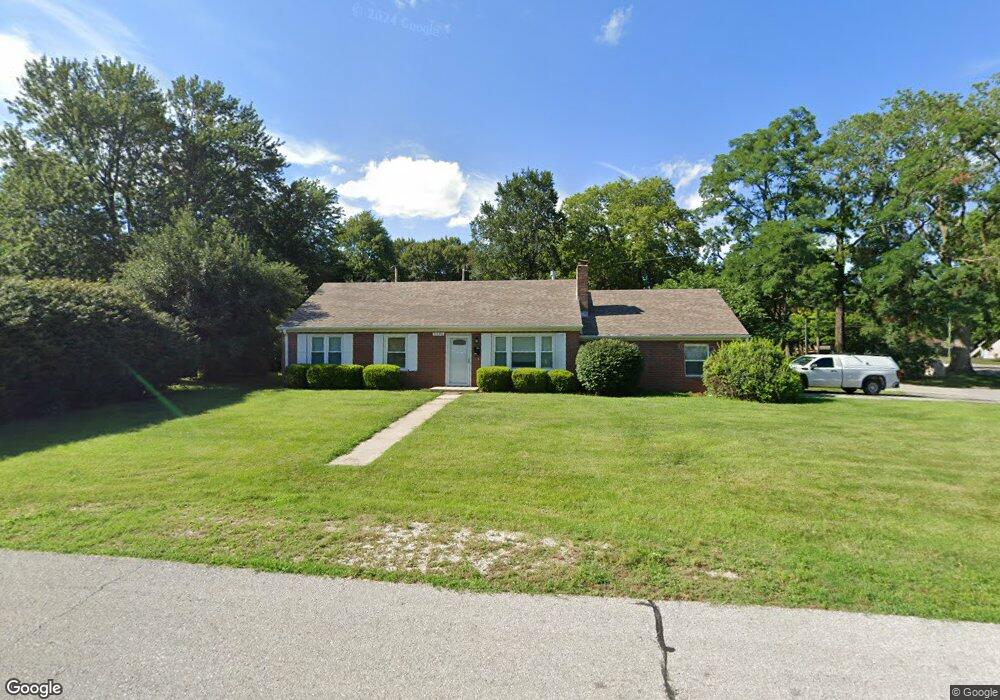
11104 W 54th St Shawnee, KS 66203
Estimated Value: $302,000 - $323,000
3
Beds
2
Baths
1,376
Sq Ft
$227/Sq Ft
Est. Value
About This Home
This home is located at 11104 W 54th St, Shawnee, KS 66203 and is currently estimated at $311,981, approximately $226 per square foot. 11104 W 54th St is a home located in Johnson County with nearby schools including Bluejacket / Flint Elementary, Hocker Grove Middle School, and Shawnee Mission North High School.
Ownership History
Date
Name
Owned For
Owner Type
Purchase Details
Closed on
Sep 11, 2007
Sold by
Lingle Naomi M
Bought by
Lingle Naomi M and Rodriguez Jose T
Current Estimated Value
Home Financials for this Owner
Home Financials are based on the most recent Mortgage that was taken out on this home.
Original Mortgage
$150,000
Interest Rate
6.69%
Mortgage Type
New Conventional
Purchase Details
Closed on
Aug 7, 2007
Sold by
Gerfen Craig W and Gerfen Christi L
Bought by
Lingle Naomi M
Home Financials for this Owner
Home Financials are based on the most recent Mortgage that was taken out on this home.
Original Mortgage
$150,000
Interest Rate
6.69%
Mortgage Type
New Conventional
Purchase Details
Closed on
Sep 25, 2001
Sold by
Zillner Jake T and Zillner Jennifer L
Bought by
Gerfen Craig W and Gerfen Christi L
Home Financials for this Owner
Home Financials are based on the most recent Mortgage that was taken out on this home.
Original Mortgage
$109,000
Interest Rate
6.88%
Create a Home Valuation Report for This Property
The Home Valuation Report is an in-depth analysis detailing your home's value as well as a comparison with similar homes in the area
Home Values in the Area
Average Home Value in this Area
Purchase History
| Date | Buyer | Sale Price | Title Company |
|---|---|---|---|
| Lingle Naomi M | -- | Accurate Title Co Llc | |
| Lingle Naomi M | -- | First American Title Ins Co | |
| Gerfen Craig W | -- | Stewart Title |
Source: Public Records
Mortgage History
| Date | Status | Borrower | Loan Amount |
|---|---|---|---|
| Previous Owner | Lingle Naomi M | $150,000 | |
| Previous Owner | Gerfen Craig W | $109,000 |
Source: Public Records
Tax History Compared to Growth
Tax History
| Year | Tax Paid | Tax Assessment Tax Assessment Total Assessment is a certain percentage of the fair market value that is determined by local assessors to be the total taxable value of land and additions on the property. | Land | Improvement |
|---|---|---|---|---|
| 2024 | $3,169 | $30,176 | $5,734 | $24,442 |
| 2023 | $3,234 | $30,210 | $5,215 | $24,995 |
| 2022 | $2,758 | $25,680 | $4,737 | $20,943 |
| 2021 | $2,730 | $23,748 | $4,117 | $19,631 |
| 2020 | $2,658 | $22,816 | $3,744 | $19,072 |
| 2019 | $2,274 | $19,481 | $3,563 | $15,918 |
| 2018 | $2,188 | $18,665 | $3,563 | $15,102 |
| 2017 | $2,071 | $17,388 | $3,238 | $14,150 |
| 2016 | $1,980 | $16,399 | $3,238 | $13,161 |
| 2015 | $1,800 | $15,582 | $3,238 | $12,344 |
| 2013 | -- | $14,179 | $3,238 | $10,941 |
Source: Public Records
Map
Nearby Homes
- 5308 Mcanany Dr
- 11002 W 55th Terrace
- 11403 W 51st Terrace
- 11815 W 53rd St
- Ashwood Plan at Bristol Highlands - North
- The Fleetwood Plan at Bristol Highlands - The Villas
- Cypress II Plan at Bristol Highlands - North
- The Fleetwood Plan at Bristol Highlands - The Manors
- The Brentwood Plan at Bristol Highlands - The Villas
- Yorkshire V Plan at Bristol Highlands - North
- The Kirkwood Plan at Bristol Highlands - The Villas
- 8013 Payne St
- The Rockwood Plan at Bristol Highlands - The Villas
- Magnolia Plan at Bristol Highlands - North
- 5407 Halsey St
- 10511 W 49th Place
- 10116 W 52nd Terrace
- 13126 W 52nd Terrace
- 13134 W 52nd Terrace
- 13130 W 52nd Terrace
- 5324 Nieman Rd
- 11120 W 54th St
- 11109 W 54th St
- 11101 W 54th St
- 11115 W 54th St
- 5318 Mcanany Dr
- 11121 W 54th St
- 11202 W 54th St
- 5404 Nieman Rd
- 11203 W 54th St
- 5314 Mcanany Dr
- 5311 Barton Dr
- 11208 W 54th St
- 11208 Lecluyse Dr
- 5408 Nieman Rd
- 5306 Nieman Rd
- 5313 Nieman Rd
- 11215 W 54th St
- 5310 Mcanany Dr
- 5305 Barton Dr