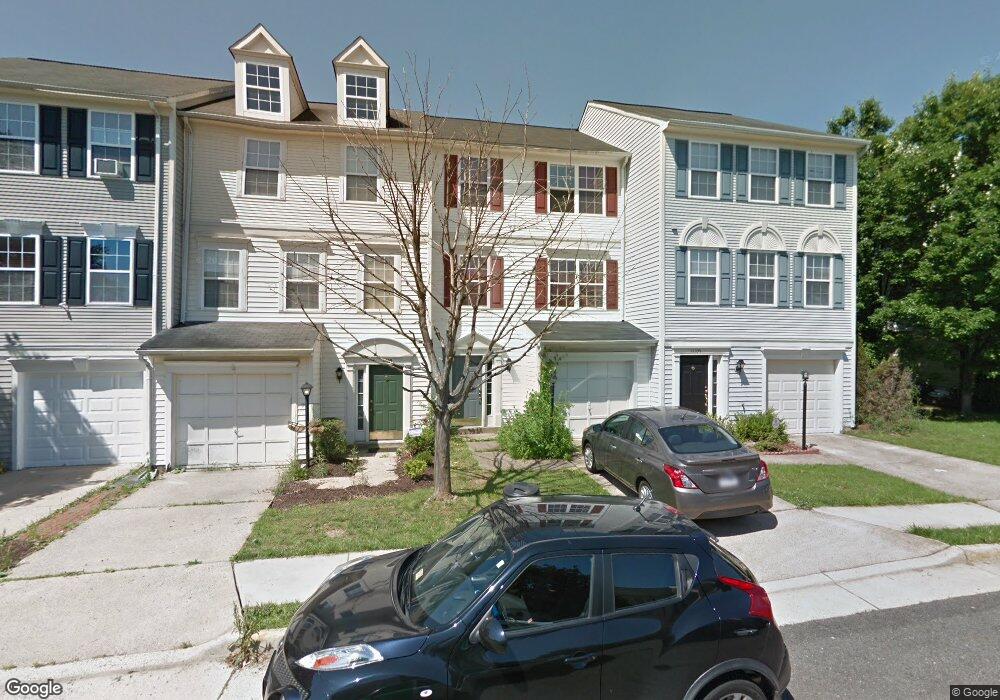
11107 Light Guard Loop Manassas, VA 20109
Estimated Value: $404,000 - $457,000
3
Beds
2
Baths
1,376
Sq Ft
$308/Sq Ft
Est. Value
About This Home
This home is located at 11107 Light Guard Loop, Manassas, VA 20109 and is currently estimated at $423,508, approximately $307 per square foot. 11107 Light Guard Loop is a home located in Prince William County with nearby schools including George P. Mullen Elementary School, Bull Run Middle School, and Unity Reed High School.
Ownership History
Date
Name
Owned For
Owner Type
Purchase Details
Closed on
Jun 8, 1998
Sold by
Wilkins Shirley F
Bought by
Mendoza+ Moris A
Current Estimated Value
Home Financials for this Owner
Home Financials are based on the most recent Mortgage that was taken out on this home.
Original Mortgage
$104,908
Outstanding Balance
$20,409
Interest Rate
7.05%
Mortgage Type
FHA
Estimated Equity
$403,099
Purchase Details
Closed on
Sep 1, 1995
Sold by
Rocky Gorge At Jacksons Ridge
Bought by
Wilkins Shirley F
Home Financials for this Owner
Home Financials are based on the most recent Mortgage that was taken out on this home.
Original Mortgage
$110,839
Interest Rate
7.61%
Create a Home Valuation Report for This Property
The Home Valuation Report is an in-depth analysis detailing your home's value as well as a comparison with similar homes in the area
Home Values in the Area
Average Home Value in this Area
Purchase History
| Date | Buyer | Sale Price | Title Company |
|---|---|---|---|
| Mendoza+ Moris A | $105,000 | -- | |
| Wilkins Shirley F | $111,000 | -- |
Source: Public Records
Mortgage History
| Date | Status | Borrower | Loan Amount |
|---|---|---|---|
| Open | Wilkins Shirley F | $104,908 | |
| Previous Owner | Wilkins Shirley F | $110,839 |
Source: Public Records
Tax History
| Year | Tax Paid | Tax Assessment Tax Assessment Total Assessment is a certain percentage of the fair market value that is determined by local assessors to be the total taxable value of land and additions on the property. | Land | Improvement |
|---|---|---|---|---|
| 2025 | $3,262 | $337,000 | $94,000 | $243,000 |
| 2024 | $3,262 | $328,000 | $89,900 | $238,100 |
| 2023 | $3,274 | $314,700 | $87,000 | $227,700 |
| 2022 | $3,483 | $305,800 | $82,900 | $222,900 |
| 2021 | $3,547 | $288,500 | $75,500 | $213,000 |
| 2020 | $4,247 | $274,000 | $75,500 | $198,500 |
| 2019 | $4,109 | $265,100 | $75,500 | $189,600 |
| 2018 | $3,068 | $254,100 | $73,900 | $180,200 |
| 2017 | $3,066 | $246,400 | $71,000 | $175,400 |
| 2016 | $2,773 | $224,300 | $67,500 | $156,800 |
| 2015 | $2,710 | $227,100 | $67,500 | $159,600 |
| 2014 | $2,710 | $214,400 | $62,500 | $151,900 |
Source: Public Records
Map
Nearby Homes
- 7989 Flager Cir
- 11112 Stagestone Way
- 7860 Rebel Walk Dr
- 10815 Campaign Ct
- 7989 Copperfield Way
- 7930 Calvary Ct
- 7938 Blue Gray Cir
- 8003 Copperfield Way
- 10998 Koman Cir Unit 204
- 8087 Lacy Dr Unit 204
- 7823 Sabre Ct
- 7598 Gales Ct Unit 102
- 8075 Lacy Dr Unit 101
- 11021 Folksie Ct Unit 102
- 8073 Stonewall Brigade Ct
- 7516 Purdue Ct
- 11363 Wheeler Ridge Dr
- 7452 Wilmer Way
- 10745 Coverstone Dr
- 11202 Balls Ford Rd
- 11105 Light Guard Loop
- 11109 Light Guard Loop
- 11103 Light Guard Loop
- 11101 Light Guard Loop
- 11113 Light Guard Loop
- 11115 Light Guard Loop
- 11117 Light Guard Loop
- 11119 Light Guard Loop
- 11106 Light Guard Loop
- 11104 Light Guard Loop
- 11108 Light Guard Loop
- 11110 Light Guard Loop
- 11102 Light Guard Loop
- 11160 Adler Ln
- 11112 Light Guard Loop
- 11100 Light Guard Loop
- 11121 Light Guard Loop
- 11114 Light Guard Loop
- 11123 Light Guard Loop
- 11118 Light Guard Loop
Your Personal Tour Guide
Ask me questions while you tour the home.