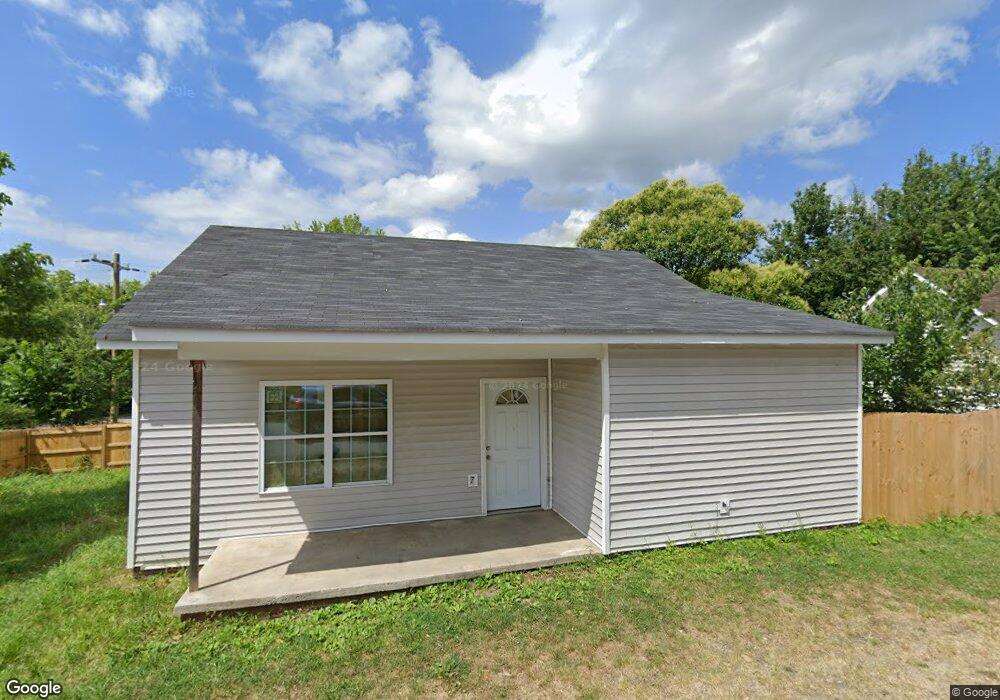
1111 2nd St Lancaster, SC 29720
Estimated Value: $70,892 - $262,000
1
Bed
1
Bath
922
Sq Ft
$163/Sq Ft
Est. Value
About This Home
This home is located at 1111 2nd St, Lancaster, SC 29720 and is currently estimated at $149,964, approximately $162 per square foot. 1111 2nd St is a home located in Lancaster County with nearby schools including Brooklyn Springs Elementary School, Buford Middle School, and Lancaster High School.
Ownership History
Date
Name
Owned For
Owner Type
Purchase Details
Closed on
Aug 14, 2020
Sold by
Mingo Eddie
Bought by
Arredondo Jose Alfredo Gutierrez
Current Estimated Value
Purchase Details
Closed on
Oct 29, 2010
Sold by
Massey Arthur
Bought by
Roof Ricky P
Purchase Details
Closed on
Mar 21, 2007
Sold by
Branch Banking & Trust Co Of Sc
Bought by
Massey Arthur
Purchase Details
Closed on
Dec 28, 2005
Sold by
Johnston William E
Bought by
Branch Banking & Trust Co South Carolina
Purchase Details
Closed on
Dec 9, 2002
Sold by
Real Estate Investment Capital Inc
Bought by
Johnston William E
Purchase Details
Closed on
Aug 7, 2002
Sold by
Lancaster Property Investments Llc
Bought by
Real Estate Investment Capital Inc
Purchase Details
Closed on
Jun 14, 2002
Sold by
Sellers Delbert and Sellers Delbert R
Bought by
Trimnal Brian O and Trimnal Pamela D
Purchase Details
Closed on
Mar 22, 2001
Sold by
Eddins Joseph Mack and Eddins Sara Lee Jernigan
Bought by
Sellers Delbert
Create a Home Valuation Report for This Property
The Home Valuation Report is an in-depth analysis detailing your home's value as well as a comparison with similar homes in the area
Home Values in the Area
Average Home Value in this Area
Purchase History
| Date | Buyer | Sale Price | Title Company |
|---|---|---|---|
| Arredondo Jose Alfredo Gutierrez | $3,000 | None Available | |
| Mingo Eddie | -- | None Available | |
| Roof Ricky P | $4,900 | -- | |
| Massey Arthur | $3,300 | None Available | |
| Branch Banking & Trust Co South Carolina | $500 | None Available | |
| Johnston William E | $90,000 | -- | |
| Real Estate Investment Capital Inc | $90,000 | -- | |
| Trimnal Brian O | $60,000 | -- | |
| Sellers Delbert | $44,727 | -- |
Source: Public Records
Tax History
| Year | Tax Paid | Tax Assessment Tax Assessment Total Assessment is a certain percentage of the fair market value that is determined by local assessors to be the total taxable value of land and additions on the property. | Land | Improvement |
|---|---|---|---|---|
| 2024 | $162 | $486 | $120 | $366 |
| 2023 | $167 | $486 | $120 | $366 |
| 2022 | $162 | $486 | $120 | $366 |
| 2021 | $159 | $486 | $120 | $366 |
| 2020 | $146 | $450 | $120 | $330 |
| 2019 | $152 | $450 | $120 | $330 |
| 2018 | $146 | $450 | $120 | $330 |
| 2017 | $137 | $0 | $0 | $0 |
| 2016 | $136 | $0 | $0 | $0 |
| 2015 | $119 | $0 | $0 | $0 |
| 2014 | $119 | $0 | $0 | $0 |
| 2013 | $119 | $0 | $0 | $0 |
Source: Public Records
Map
Nearby Homes
- 126 S Jackson Rd
- 1257 Springdale Rd
- 119 Barron Blvd
- 117 Barron Blvd
- 962 13th St
- 514 W Barr St
- 439 South Ave
- 310 Elm St
- 308 Elm St
- 707 W Barr St
- 1008 14th St
- 304 W Gay St
- 314 S French St
- 302 W Gay St
- 300 Elm St
- 1451 Kings Cir
- 406 S Catawba St
- 406 N Pine St
- 1334 Williams Estate Dr
- TBD Williams Estate Dr