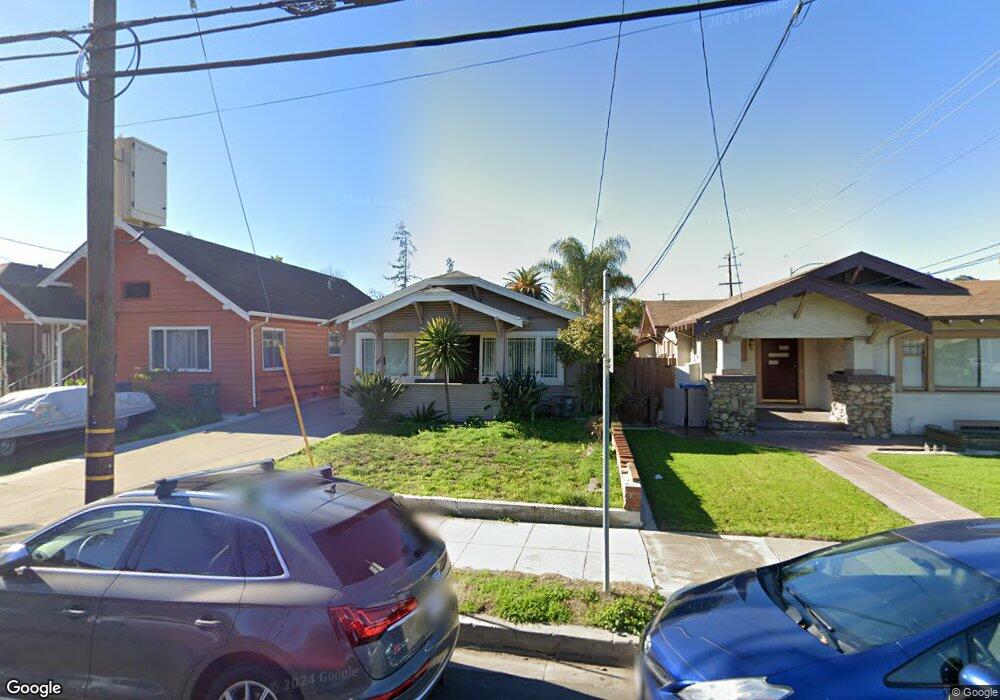
1111 Sherman St San Jose, CA 95110
Tamien NeighborhoodEstimated Value: $826,674 - $969,000
2
Beds
1
Bath
1,092
Sq Ft
$810/Sq Ft
Est. Value
About This Home
This home is located at 1111 Sherman St, San Jose, CA 95110 and is currently estimated at $884,169, approximately $809 per square foot. 1111 Sherman St is a home located in Santa Clara County with nearby schools including Washington Elementary School, Willow Glen Middle, and Willow Glen High School.
Ownership History
Date
Name
Owned For
Owner Type
Purchase Details
Closed on
Feb 12, 2021
Sold by
Tharaud Maria C and Tharaud Family Living Trust
Bought by
Salcido Sergio
Current Estimated Value
Purchase Details
Closed on
Feb 21, 2012
Sold by
Tharaud Maria C
Bought by
Tharaud Maria C
Purchase Details
Closed on
Jun 23, 2010
Sold by
Tharaud Maria C
Bought by
Tharaud Maria C
Purchase Details
Closed on
Mar 7, 2003
Sold by
Sanchez Virginia G and Sanchez Nicomedes L
Bought by
Sanchez Nicomedes L and Sanchez Virginia G
Purchase Details
Closed on
Jan 12, 2001
Sold by
The Virginia G & Nicomedes L Sanchez Rev and Sanchez Virginia G
Bought by
Sanchez Virginia G and Sanchez Nicomedes L
Purchase Details
Closed on
Jul 13, 2000
Sold by
Sanchez Nicomedes L
Bought by
Sanchez Virginia G
Purchase Details
Closed on
Nov 1, 1995
Sold by
Sanchez Nicomedes L and Sanchez Virginia G
Bought by
Sanchez Virginia G and Sanchez Nicomedes L
Create a Home Valuation Report for This Property
The Home Valuation Report is an in-depth analysis detailing your home's value as well as a comparison with similar homes in the area
Home Values in the Area
Average Home Value in this Area
Purchase History
| Date | Buyer | Sale Price | Title Company |
|---|---|---|---|
| Salcido Sergio | -- | None Available | |
| Tharaud Maria C | -- | None Available | |
| Tharaud Maria C | -- | None Available | |
| Sanchez Nicomedes L | -- | -- | |
| Sanchez Virginia G | -- | -- | |
| Sanchez Virginia G | -- | Financial Title Company | |
| Sanchez Virginia G | -- | -- |
Source: Public Records
Tax History Compared to Growth
Tax History
| Year | Tax Paid | Tax Assessment Tax Assessment Total Assessment is a certain percentage of the fair market value that is determined by local assessors to be the total taxable value of land and additions on the property. | Land | Improvement |
|---|---|---|---|---|
| 2025 | $4,193 | $174,590 | $105,918 | $68,672 |
| 2024 | $4,193 | $171,168 | $103,842 | $67,326 |
| 2023 | $4,063 | $167,812 | $101,806 | $66,006 |
| 2022 | $4,010 | $164,522 | $99,810 | $64,712 |
| 2021 | $3,844 | $161,297 | $97,853 | $63,444 |
| 2020 | $3,177 | $159,644 | $96,850 | $62,794 |
| 2019 | $3,087 | $156,514 | $94,951 | $61,563 |
| 2018 | $3,036 | $153,446 | $93,090 | $60,356 |
| 2017 | $2,997 | $150,438 | $91,265 | $59,173 |
| 2016 | $2,858 | $147,489 | $89,476 | $58,013 |
| 2015 | $2,825 | $145,274 | $88,132 | $57,142 |
| 2014 | $2,408 | $142,429 | $86,406 | $56,023 |
Source: Public Records
Map
Nearby Homes
- 1210 Mastic St
- 82 Hollywood Ave
- 1060 S 3rd St Unit 379
- 1060 S 3rd St Unit 179
- 1060 S 3rd St Unit 233
- 1060 S 3rd St Unit 216
- 1060 S 3rd St Unit 129
- 1060 S 3rd St Unit 344
- 114 Hollywood Ave
- 85 Oak St
- 896 S Almaden Ave
- 1144 Locust St
- 198 Floyd St
- 1148 Palm St
- 1493 Sanborn Ave
- 1497 Sanborn Ave
- 1488 Pomona Ave
- 961 S 7th St
- 1376 Palm St
- 316 Stonegate Cir
- 1121 Sherman St
- 1101 Sherman St
- 74 Goodyear St
- 1129 Sherman St
- 78 Goodyear St
- 48 Goodyear St
- 1131 Sherman St
- 82 Goodyear St
- 1145 Sherman St
- 42 Goodyear St
- 90 Goodyear St
- 1128 Mastic St
- 1118 Sherman St
- 1081 Sherman St
- 1120 Sherman St
- 1157 Sherman St
- 36 Goodyear St
- 1122 Sherman St
- 1136 Mastic St
- 49 Goodyear St