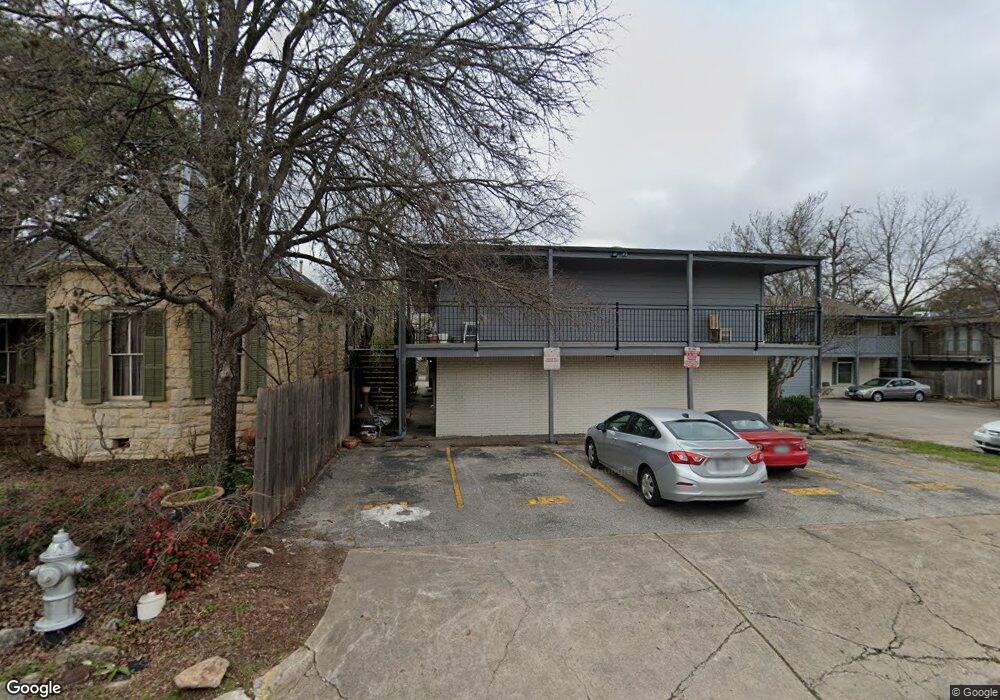
1111 W 10th St Unit 112 Austin, TX 78703
Clarksville NeighborhoodEstimated Value: $197,000 - $780,000
Studio
--
Bath
341
Sq Ft
$1,067/Sq Ft
Est. Value
About This Home
This home is located at 1111 W 10th St Unit 112, Austin, TX 78703 and is currently estimated at $363,685, approximately $1,066 per square foot. 1111 W 10th St Unit 112 is a home located in Travis County with nearby schools including Mathews Elementary School, Austin High School, and Headwaters School.
Ownership History
Date
Name
Owned For
Owner Type
Purchase Details
Closed on
Jan 5, 2006
Sold by
Lonwin Ltd
Bought by
Sprague Charles R
Current Estimated Value
Home Financials for this Owner
Home Financials are based on the most recent Mortgage that was taken out on this home.
Original Mortgage
$58,500
Interest Rate
9.72%
Mortgage Type
Purchase Money Mortgage
Purchase Details
Closed on
Aug 12, 2003
Sold by
Winsor Curtin and London Monique Janelle
Bought by
Lonwin Ltd
Home Financials for this Owner
Home Financials are based on the most recent Mortgage that was taken out on this home.
Original Mortgage
$40,175
Interest Rate
6.12%
Mortgage Type
Seller Take Back
Purchase Details
Closed on
Sep 12, 1995
Sold by
Jeffcoat Alan L
Bought by
Lea Curtis E
Home Financials for this Owner
Home Financials are based on the most recent Mortgage that was taken out on this home.
Original Mortgage
$15,050
Interest Rate
7.77%
Create a Home Valuation Report for This Property
The Home Valuation Report is an in-depth analysis detailing your home's value as well as a comparison with similar homes in the area
Home Values in the Area
Average Home Value in this Area
Purchase History
| Date | Buyer | Sale Price | Title Company |
|---|---|---|---|
| Sprague Charles R | -- | Heritage Title | |
| Lonwin Ltd | -- | -- | |
| Lea Curtis E | -- | -- |
Source: Public Records
Mortgage History
| Date | Status | Borrower | Loan Amount |
|---|---|---|---|
| Previous Owner | Sprague Charles R | $58,500 | |
| Previous Owner | Lonwin Ltd | $40,175 | |
| Previous Owner | Lea Curtis E | $15,050 |
Source: Public Records
Tax History
| Year | Tax Paid | Tax Assessment Tax Assessment Total Assessment is a certain percentage of the fair market value that is determined by local assessors to be the total taxable value of land and additions on the property. | Land | Improvement |
|---|---|---|---|---|
| 2025 | $44 | $193,772 | -- | -- |
| 2023 | $2,897 | $160,142 | $0 | $0 |
| 2022 | $2,875 | $145,584 | $0 | $0 |
| 2021 | $2,881 | $132,349 | $0 | $0 |
| 2020 | $2,581 | $120,317 | $46,200 | $74,117 |
| 2018 | $2,791 | $126,050 | $46,200 | $87,231 |
| 2017 | $2,556 | $114,591 | $339 | $123,471 |
| 2016 | $2,323 | $104,174 | $33,880 | $70,294 |
| 2015 | $591 | $103,676 | $33,880 | $71,791 |
| 2014 | $591 | $94,251 | $0 | $0 |
Source: Public Records
Map
Nearby Homes
- 1000 Baylor St
- 1010 W 10th St Unit 203
- 1006 Baylor St Unit 201
- 1006 Baylor St Unit 202
- 1003 Blanco St
- 902 Blanco St
- 613 Baylor St
- 1115 W 7th St Unit 202
- 1115 W 7th St Unit 106
- 1201 W 8th St
- 901 W 9th St Unit 706
- 901 W 9th St Unit 703
- 1111 W 12th St Unit 102
- 904 West Ave Unit 114
- 904 West Ave Unit 214B
- 904 West Ave Unit 201
- 904 West Ave Unit 213
- 1210 Windsor Rd Unit 216
- 1210 Windsor Rd Unit 122
- 701 Brownlee Cir
- 1111 W 10th St Unit 214
- 1111 W 10th St Unit 213
- 1111 W 10th St Unit 212
- 1111 W 10th St Unit 211
- 1111 W 10th St Unit 210
- 1111 W 10th St Unit 209
- 1111 W 10th St Unit 208
- 1111 W 10th St Unit 207
- 1111 W 10th St Unit 205
- 1111 W 10th St Unit 204
- 1111 W 10th St Unit 203
- 1111 W 10th St Unit 202
- 1111 W 10th St Unit 201
- 1111 W 10th St Unit 114
- 1111 W 10th St Unit 113
- 1111 W 10th St Unit 111
- 1111 W 10th St Unit 110
- 1111 W 10th St Unit 109
- 1111 W 10th St Unit 108
- 1111 W 10th St Unit 107
Your Personal Tour Guide
Ask me questions while you tour the home.