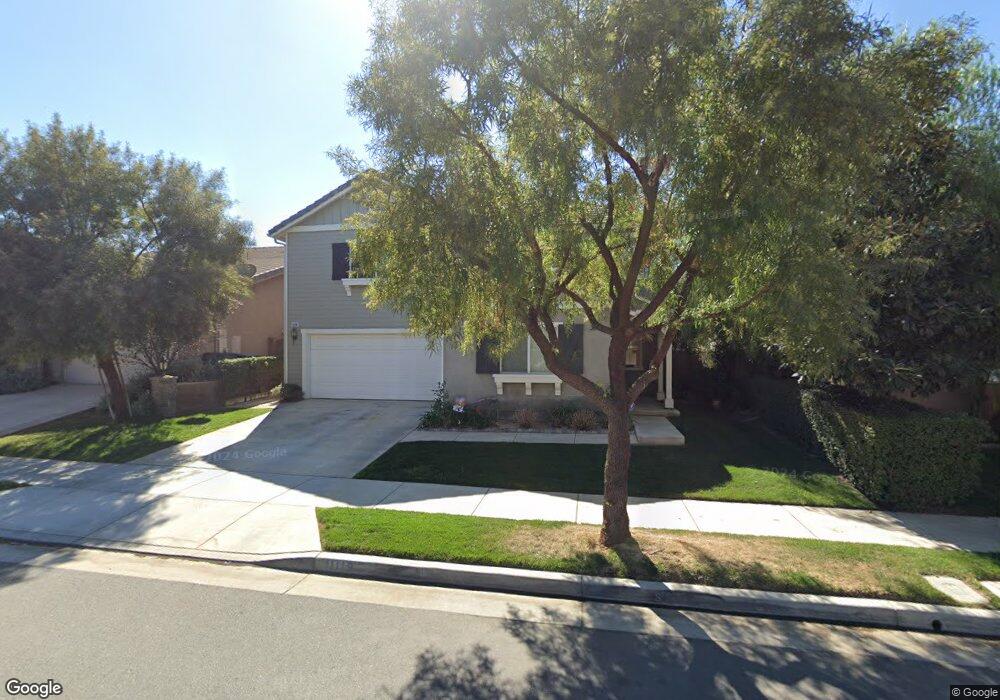
11119 Evergreen Loop Corona, CA 92883
Sycamore Creek NeighborhoodEstimated Value: $752,326 - $807,000
3
Beds
3
Baths
3,000
Sq Ft
$260/Sq Ft
Est. Value
About This Home
This home is located at 11119 Evergreen Loop, Corona, CA 92883 and is currently estimated at $781,082, approximately $260 per square foot. 11119 Evergreen Loop is a home located in Riverside County with nearby schools including Dr. Bernice Jameson Todd Academy and Centennial High School.
Ownership History
Date
Name
Owned For
Owner Type
Purchase Details
Closed on
Feb 17, 2010
Sold by
Siapno Christine
Bought by
Myers David Robert and Myers Susan Knoeppel
Current Estimated Value
Home Financials for this Owner
Home Financials are based on the most recent Mortgage that was taken out on this home.
Original Mortgage
$311,253
Outstanding Balance
$208,252
Interest Rate
5.25%
Mortgage Type
FHA
Estimated Equity
$572,830
Purchase Details
Closed on
Mar 8, 2005
Sold by
Siapno Oliver
Bought by
Siapno Christine
Home Financials for this Owner
Home Financials are based on the most recent Mortgage that was taken out on this home.
Original Mortgage
$442,650
Interest Rate
6.12%
Mortgage Type
Purchase Money Mortgage
Purchase Details
Closed on
Mar 7, 2005
Sold by
Fieldstone Sycamore Bluffs Llc
Bought by
Siapno Oliver and Siapno Christine
Home Financials for this Owner
Home Financials are based on the most recent Mortgage that was taken out on this home.
Original Mortgage
$442,650
Interest Rate
6.12%
Mortgage Type
Purchase Money Mortgage
Create a Home Valuation Report for This Property
The Home Valuation Report is an in-depth analysis detailing your home's value as well as a comparison with similar homes in the area
Home Values in the Area
Average Home Value in this Area
Purchase History
| Date | Buyer | Sale Price | Title Company |
|---|---|---|---|
| Myers David Robert | $322,000 | Ort | |
| Siapno Christine | -- | First American Title Company | |
| Siapno Oliver | $553,500 | First American Title Company |
Source: Public Records
Mortgage History
| Date | Status | Borrower | Loan Amount |
|---|---|---|---|
| Open | Myers David Robert | $311,253 | |
| Previous Owner | Siapno Oliver | $442,650 | |
| Closed | Siapno Oliver | $55,300 |
Source: Public Records
Tax History
| Year | Tax Paid | Tax Assessment Tax Assessment Total Assessment is a certain percentage of the fair market value that is determined by local assessors to be the total taxable value of land and additions on the property. | Land | Improvement |
|---|---|---|---|---|
| 2025 | $7,521 | $415,846 | $154,980 | $260,866 |
| 2023 | $7,521 | $399,700 | $148,963 | $250,737 |
| 2022 | $7,407 | $391,864 | $146,043 | $245,821 |
| 2021 | $7,288 | $384,181 | $143,180 | $241,001 |
| 2020 | $7,221 | $380,242 | $141,712 | $238,530 |
| 2019 | $7,226 | $372,787 | $138,934 | $233,853 |
| 2018 | $7,273 | $365,478 | $136,210 | $229,268 |
| 2017 | $7,141 | $358,313 | $133,540 | $224,773 |
| 2016 | $7,191 | $351,288 | $130,922 | $220,366 |
| 2015 | $7,183 | $346,013 | $128,956 | $217,057 |
| 2014 | $7,211 | $339,237 | $126,431 | $212,806 |
Source: Public Records
Map
Nearby Homes
- 11894 Greenpeak St
- 25183 Forest St
- 4078 Summer Way
- 3945 Lavine Way Unit 101
- 4044 Shada Ln
- 25130 Pacific Crest St
- 24892 Pine Mountain Terrace
- 25380 Coral Canyon Rd
- 10798 Rosemary Way
- 11416 Magnolia St
- 10889 Cameron Ct
- 10877 Cameron Ct
- 3950 Satsuma Ln
- 25465 Hyacinth St
- 24636 Overlook Dr
- 25451 Jack Rabbit Ln
- 11514 Elderberry Ln
- 11407 Alton Dr
- 24821 Elison Ct
- 11137 Briar Rose Ct
- 11111 Evergreen Loop
- 11127 Evergreen Loop
- 11103 Evergreen Loop
- 11084 Sweetgum St
- 11092 Sweetgum St
- 11076 Sweetgum St
- 11095 Evergreen Loop
- 11068 Sweetgum St
- 11114 Evergreen Loop
- 11122 Evergreen Loop
- 11106 Evergreen Loop
- 11130 Evergreen Loop
- 11098 Evergreen Loop
- 11090 Evergreen Loop
- 11146 Evergreen Loop
- 24999 Catkin St
- 11052 Sweetgum St
- 11079 Evergreen Loop
- 25068 Catkin St
- 11095 Sweetgum St
Your Personal Tour Guide
Ask me questions while you tour the home.