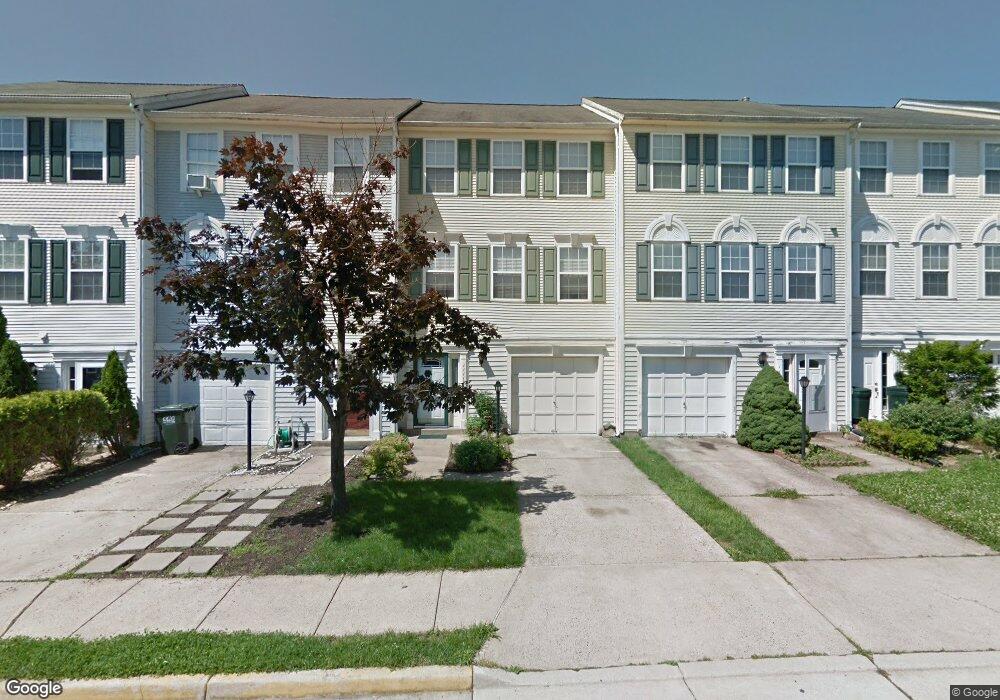
11119 Light Guard Loop Manassas, VA 20109
Estimated Value: $402,000 - $485,000
3
Beds
2
Baths
1,360
Sq Ft
$320/Sq Ft
Est. Value
About This Home
This home is located at 11119 Light Guard Loop, Manassas, VA 20109 and is currently estimated at $435,206, approximately $320 per square foot. 11119 Light Guard Loop is a home located in Prince William County with nearby schools including George P. Mullen Elementary School, Bull Run Middle School, and Unity Reed High School.
Ownership History
Date
Name
Owned For
Owner Type
Purchase Details
Closed on
Jan 22, 2004
Sold by
Omson Robert H
Bought by
Lindgren Philip
Current Estimated Value
Home Financials for this Owner
Home Financials are based on the most recent Mortgage that was taken out on this home.
Original Mortgage
$212,400
Outstanding Balance
$95,677
Interest Rate
5.82%
Mortgage Type
New Conventional
Estimated Equity
$339,529
Purchase Details
Closed on
Dec 27, 2000
Sold by
Teixeria Jaoao M
Bought by
Jones Andre E
Home Financials for this Owner
Home Financials are based on the most recent Mortgage that was taken out on this home.
Original Mortgage
$142,590
Interest Rate
7.7%
Purchase Details
Closed on
Aug 1, 1996
Sold by
Rocky Gorge At Jackson Ridge
Bought by
Teixeira Joao M
Home Financials for this Owner
Home Financials are based on the most recent Mortgage that was taken out on this home.
Original Mortgage
$116,900
Interest Rate
8.27%
Create a Home Valuation Report for This Property
The Home Valuation Report is an in-depth analysis detailing your home's value as well as a comparison with similar homes in the area
Home Values in the Area
Average Home Value in this Area
Purchase History
| Date | Buyer | Sale Price | Title Company |
|---|---|---|---|
| Lindgren Philip | $124,000 | -- | |
| Jones Andre E | $147,000 | -- | |
| Teixeira Joao M | $116,990 | -- |
Source: Public Records
Mortgage History
| Date | Status | Borrower | Loan Amount |
|---|---|---|---|
| Open | Lindgren Philip | $212,400 | |
| Previous Owner | Jones Andre E | $142,590 | |
| Previous Owner | Teixeira Joao M | $116,900 |
Source: Public Records
Tax History
| Year | Tax Paid | Tax Assessment Tax Assessment Total Assessment is a certain percentage of the fair market value that is determined by local assessors to be the total taxable value of land and additions on the property. | Land | Improvement |
|---|---|---|---|---|
| 2025 | $3,309 | $340,800 | $94,000 | $246,800 |
| 2024 | $3,309 | $332,700 | $89,900 | $242,800 |
| 2023 | $3,322 | $319,300 | $87,000 | $232,300 |
| 2022 | $3,530 | $310,100 | $82,900 | $227,200 |
| 2021 | $3,594 | $292,400 | $75,500 | $216,900 |
| 2020 | $4,304 | $277,700 | $75,500 | $202,200 |
| 2019 | $4,160 | $268,400 | $75,500 | $192,900 |
| 2018 | $3,129 | $259,100 | $73,900 | $185,200 |
| 2017 | $3,125 | $251,300 | $71,000 | $180,300 |
| 2016 | $2,822 | $228,400 | $67,500 | $160,900 |
| 2015 | $2,760 | $231,300 | $67,500 | $163,800 |
| 2014 | $2,760 | $218,500 | $62,500 | $156,000 |
Source: Public Records
Map
Nearby Homes
- 11112 Stagestone Way
- 7989 Flager Cir
- 10815 Campaign Ct
- 7930 Calvary Ct
- 7989 Copperfield Way
- 8003 Copperfield Way
- 7938 Blue Gray Cir
- 7598 Gales Ct Unit 102
- 8087 Lacy Dr Unit 204
- 10998 Koman Cir Unit 204
- 7823 Sabre Ct
- 8075 Lacy Dr Unit 101
- 7513 Mint Springs Ct
- 11021 Folksie Ct Unit 102
- 8073 Stonewall Brigade Ct
- 11363 Wheeler Ridge Dr
- 7516 Purdue Ct
- 7452 Wilmer Way
- 10745 Coverstone Dr
- 11202 Balls Ford Rd
- 11117 Light Guard Loop
- 11121 Light Guard Loop
- 11115 Light Guard Loop
- 11123 Light Guard Loop
- 11125 Light Guard Loop
- 11113 Light Guard Loop
- 11160 Adler Ln
- 11109 Light Guard Loop
- 11107 Light Guard Loop
- 11118 Light Guard Loop
- 11120 Light Guard Loop
- 11122 Light Guard Loop
- 11114 Light Guard Loop
- 11124 Light Guard Loop
- 11105 Light Guard Loop
- 11112 Light Guard Loop
- 11110 Light Guard Loop
- 11126 Light Guard Loop
- 11103 Light Guard Loop
- 11108 Light Guard Loop
Your Personal Tour Guide
Ask me questions while you tour the home.