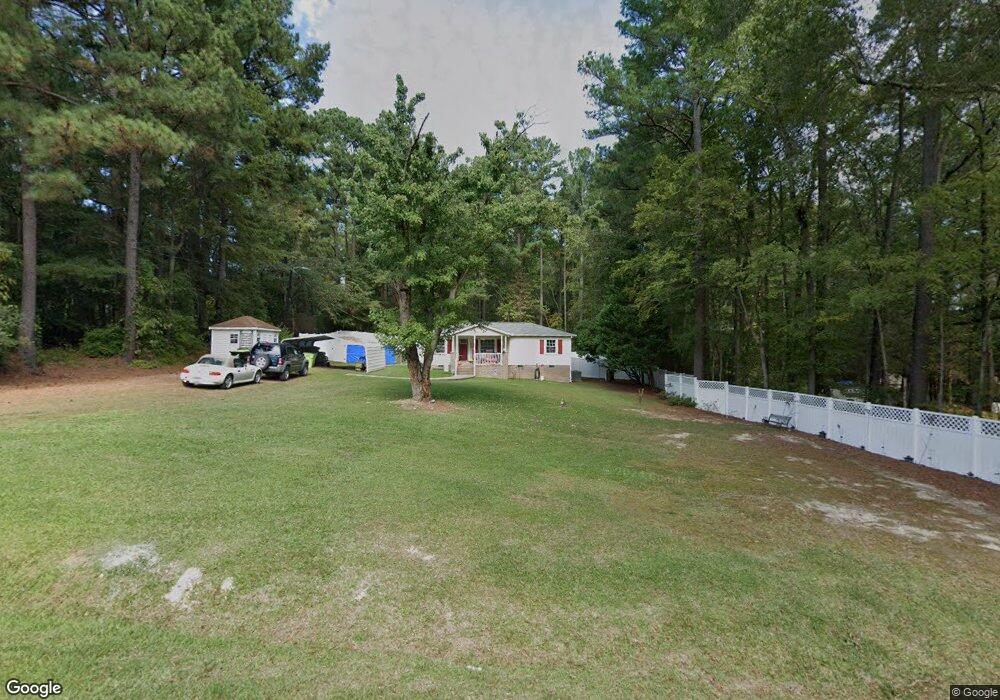
1112 Pennock Rd Durham, NC 27703
Eastern Durham NeighborhoodEstimated Value: $243,000 - $358,000
3
Beds
1
Bath
946
Sq Ft
$296/Sq Ft
Est. Value
About This Home
This home is located at 1112 Pennock Rd, Durham, NC 27703 and is currently estimated at $280,153, approximately $296 per square foot. 1112 Pennock Rd is a home located in Durham County with nearby schools including Spring Valley Elementary School, John W Neal Middle School, and Southern School of Energy & Sustainability.
Ownership History
Date
Name
Owned For
Owner Type
Purchase Details
Closed on
May 23, 2017
Sold by
Watkins Robin R and Bendt Katharine M
Bought by
Bendt Katharine M
Current Estimated Value
Purchase Details
Closed on
Mar 19, 2002
Sold by
Sloan Tammy D and Sloan Greg
Bought by
Bendt Katharine Margaret Marie and Watkins Robin Renea
Home Financials for this Owner
Home Financials are based on the most recent Mortgage that was taken out on this home.
Original Mortgage
$70,300
Outstanding Balance
$28,953
Interest Rate
6.86%
Estimated Equity
$251,200
Purchase Details
Closed on
Jan 28, 1999
Sold by
Miller Jeremy H
Bought by
Miller Tammy D
Home Financials for this Owner
Home Financials are based on the most recent Mortgage that was taken out on this home.
Original Mortgage
$49,552
Interest Rate
6.85%
Create a Home Valuation Report for This Property
The Home Valuation Report is an in-depth analysis detailing your home's value as well as a comparison with similar homes in the area
Home Values in the Area
Average Home Value in this Area
Purchase History
| Date | Buyer | Sale Price | Title Company |
|---|---|---|---|
| Bendt Katharine M | -- | None Available | |
| Bendt Katharine Margaret Marie | $74,000 | -- | |
| Miller Tammy D | -- | -- |
Source: Public Records
Mortgage History
| Date | Status | Borrower | Loan Amount |
|---|---|---|---|
| Open | Bendt Katharine Margaret Marie | $70,300 | |
| Previous Owner | Miller Tammy D | $49,552 |
Source: Public Records
Tax History
| Year | Tax Paid | Tax Assessment Tax Assessment Total Assessment is a certain percentage of the fair market value that is determined by local assessors to be the total taxable value of land and additions on the property. | Land | Improvement |
|---|---|---|---|---|
| 2025 | $1,640 | $213,951 | $112,375 | $101,576 |
| 2024 | $1,218 | $104,323 | $38,500 | $65,823 |
| 2023 | $1,170 | $104,323 | $38,500 | $65,823 |
| 2022 | $1,128 | $104,323 | $38,500 | $65,823 |
| 2021 | $915 | $104,323 | $38,500 | $65,823 |
| 2020 | $894 | $104,323 | $38,500 | $65,823 |
| 2019 | $884 | $104,323 | $38,500 | $65,823 |
| 2018 | $776 | $84,041 | $26,950 | $57,091 |
| 2017 | $750 | $84,041 | $26,950 | $57,091 |
| 2016 | $727 | $84,041 | $26,950 | $57,091 |
| 2015 | $711 | $61,914 | $19,781 | $42,133 |
| 2014 | $714 | $61,914 | $19,781 | $42,133 |
Source: Public Records
Map
Nearby Homes
- 610 Sherron Rd
- 3013 Allamore Dr
- 3015 Allamore Dr
- 3017 Allamore Dr
- 3021 Allamore Dr
- 3023 Allamore Dr
- 1020 Constellation Cir
- 701 Painted Daisy Ln
- 1202 Constellation Cir
- 1204 Constellation Cir
- 1126 Constellation Cir
- 1017 Constellation Cir
- 1118 Constellation Cir
- 1116 Constellation Cir
- 6 Dawson Ct
- 1041 Constellation Cir
- 1050 Constellation Cir
- 210 Hico Way
- 615 Southshore Pkwy
- 601 Crossing Dr
- 423 Broach Rd
- 503 Broach Rd
- 1100 Pennock Rd
- 1105 Pennock Rd
- 513 Broach Rd
- 504 Broach Rd
- 409 Broach Rd
- 418 Broach Rd
- 303 Scheer Ave
- 512 Broach Rd
- 217 Scheer Ave
- 205 Scheer Ave
- 521 Broach Rd
- 1211 Pennock Rd
- 405 Broach Rd
- 209 Scheer Ave
- 516 Broach Rd
- 1117 Mockingbird Ln
- 224 Scheer Ave
- 1113 Mockingbird Ln
Your Personal Tour Guide
Ask me questions while you tour the home.