Estimated Value: $517,000 - $556,000
3
Beds
2
Baths
1,448
Sq Ft
$370/Sq Ft
Est. Value
About This Home
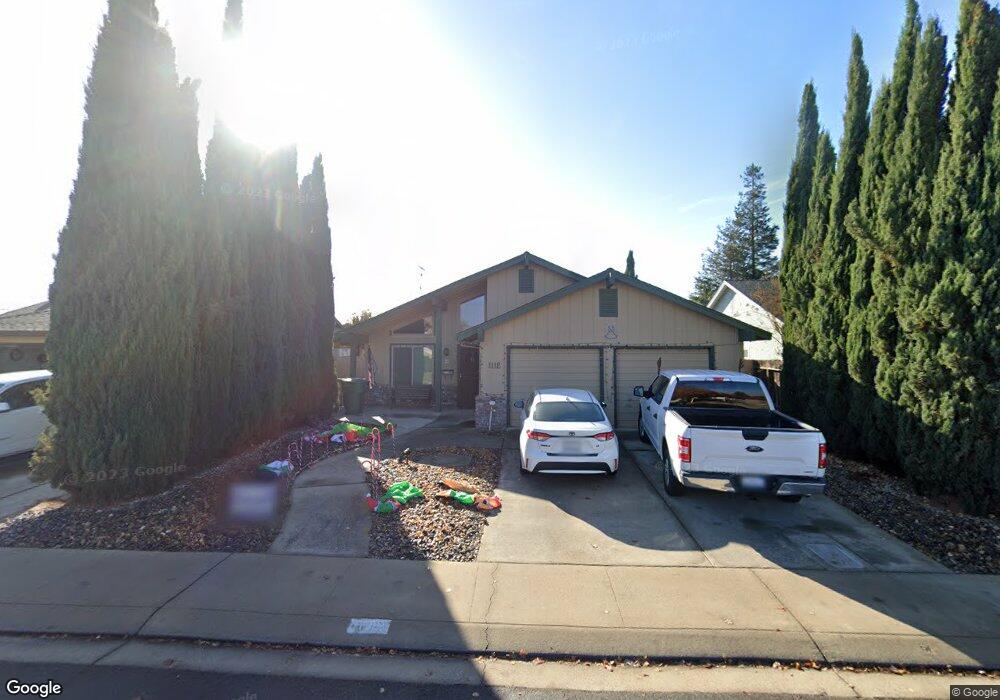
This home is located at 1112 W 4th St, Ripon, CA 95366 and is currently estimated at $536,376, approximately $370 per square foot. 1112 W 4th St is a home located in San Joaquin County with nearby schools including Weston Elementary School, Ripon Elementary School, and Park View Elementary School.
Ownership History
Date
Name
Owned For
Owner Type
Purchase Details
Closed on
Jan 31, 2018
Sold by
Brock Hilda and Doornenbal Lieske
Bought by
Brock Hilda and Doornenbal Lieske
Current Estimated Value
Purchase Details
Closed on
Feb 8, 2017
Sold by
Brock Hilda and Doornenbal Lieske
Bought by
Burns Kevin S and Burns Sarah E
Home Financials for this Owner
Home Financials are based on the most recent Mortgage that was taken out on this home.
Original Mortgage
$110,000
Interest Rate
3.99%
Mortgage Type
New Conventional
Purchase Details
Closed on
Jun 20, 1996
Sold by
Soeten Tina
Bought by
Soeten Tina
Create a Home Valuation Report for This Property
The Home Valuation Report is an in-depth analysis detailing your home's value as well as a comparison with similar homes in the area
Home Values in the Area
Average Home Value in this Area
Purchase History
| Date | Buyer | Sale Price | Title Company |
|---|---|---|---|
| Brock Hilda | -- | None Available | |
| Burns Kevin S | $320,000 | Old Republic Title Company S | |
| Soeten Tina | -- | -- |
Source: Public Records
Mortgage History
| Date | Status | Borrower | Loan Amount |
|---|---|---|---|
| Previous Owner | Burns Kevin S | $110,000 |
Source: Public Records
Tax History
| Year | Tax Paid | Tax Assessment Tax Assessment Total Assessment is a certain percentage of the fair market value that is determined by local assessors to be the total taxable value of land and additions on the property. | Land | Improvement |
|---|---|---|---|---|
| 2025 | $2,931 | $265,581 | $83,948 | $181,633 |
| 2024 | $2,884 | $260,374 | $82,302 | $178,072 |
| 2023 | $2,826 | $255,270 | $80,689 | $174,581 |
| 2022 | $2,781 | $250,265 | $79,107 | $171,158 |
| 2021 | $2,739 | $245,358 | $77,556 | $167,802 |
| 2020 | $1,969 | $173,032 | $62,466 | $110,566 |
| 2019 | $1,937 | $169,641 | $61,242 | $108,399 |
| 2018 | $1,908 | $166,316 | $60,042 | $106,274 |
| 2017 | $1,872 | $163,056 | $58,865 | $104,191 |
| 2016 | $1,842 | $159,859 | $57,711 | $102,148 |
| 2015 | $1,820 | $157,458 | $56,844 | $100,614 |
| 2014 | $1,774 | $154,375 | $55,731 | $98,644 |
Source: Public Records
Map
Nearby Homes
- 138 Roxie Ct
- 916 6th St
- 23811 S Jack Tone Rd
- 504 van Dyken Way
- 1601 Stanley Dr
- 1621 Davis St
- 924 Kingery Dr
- 227 van Dyken Way
- 1691 Davis St
- 1122 Zumstein Ct
- 150 N Acacia Ave
- 547 Sepp Ct
- 1080 Ruess Rd
- 1672 Bailey Dr
- 602 S Highland Ave
- 205 3rd St
- 637 Rebekah Ct
- 663 Clay Way
- 534 Ripona Ave
- 960 Goodwin Dr
Your Personal Tour Guide
Ask me questions while you tour the home.