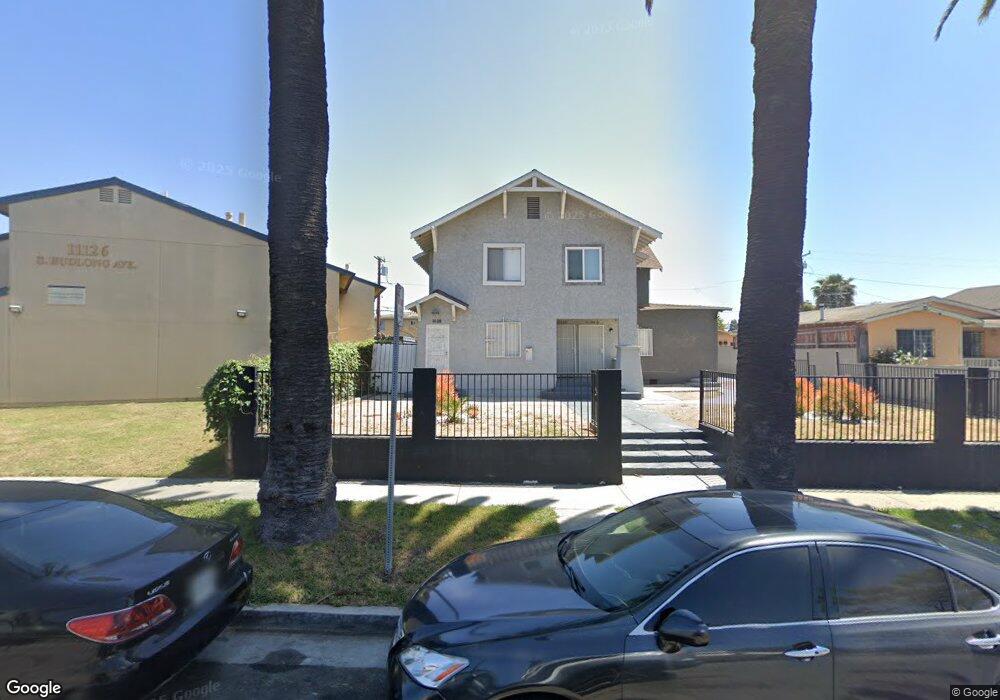
11128 S Budlong Ave Los Angeles, CA 90044
Estimated Value: $993,000 - $1,204,000
9
Beds
4
Baths
4,535
Sq Ft
$249/Sq Ft
Est. Value
About This Home
This home is located at 11128 S Budlong Ave, Los Angeles, CA 90044 and is currently estimated at $1,127,884, approximately $248 per square foot. 11128 S Budlong Ave is a home located in Los Angeles County with nearby schools including Woodcrest Elementary School, George Washington Preparatory High School, and St. Frances X. Cabrini.
Ownership History
Date
Name
Owned For
Owner Type
Purchase Details
Closed on
Apr 3, 2019
Sold by
Balow Paul
Bought by
11128 S Budlong Llc
Current Estimated Value
Home Financials for this Owner
Home Financials are based on the most recent Mortgage that was taken out on this home.
Original Mortgage
$656,000
Interest Rate
4.1%
Mortgage Type
Commercial
Purchase Details
Closed on
Mar 12, 2002
Sold by
Avondale Inc
Bought by
Balow Paul
Home Financials for this Owner
Home Financials are based on the most recent Mortgage that was taken out on this home.
Original Mortgage
$232,750
Interest Rate
6.84%
Purchase Details
Closed on
Jan 29, 2002
Sold by
Equicredit Corp Of America
Bought by
Avondale Inc
Home Financials for this Owner
Home Financials are based on the most recent Mortgage that was taken out on this home.
Original Mortgage
$232,750
Interest Rate
6.84%
Purchase Details
Closed on
Dec 17, 2001
Sold by
California/Equicredit Corp
Bought by
Equicredit Corp Of America
Home Financials for this Owner
Home Financials are based on the most recent Mortgage that was taken out on this home.
Original Mortgage
$170,000
Interest Rate
6.94%
Purchase Details
Closed on
Jul 9, 2001
Sold by
Houston Charles
Bought by
California/Equicredit Corp
Purchase Details
Closed on
Oct 4, 1999
Sold by
Crouse Jack K
Bought by
Houston Charles
Home Financials for this Owner
Home Financials are based on the most recent Mortgage that was taken out on this home.
Original Mortgage
$225,000
Interest Rate
9.99%
Purchase Details
Closed on
Jan 10, 1997
Sold by
Weirick Kristen Diane
Bought by
Crouse Jack R
Home Financials for this Owner
Home Financials are based on the most recent Mortgage that was taken out on this home.
Original Mortgage
$25,000
Interest Rate
7.53%
Purchase Details
Closed on
Feb 22, 1995
Sold by
Coast Federal Bank Fsb
Bought by
Weirick Kristen Diane and Crouse Jack
Home Financials for this Owner
Home Financials are based on the most recent Mortgage that was taken out on this home.
Original Mortgage
$131,750
Interest Rate
9.09%
Mortgage Type
Seller Take Back
Purchase Details
Closed on
Oct 20, 1994
Sold by
Torres Florentino and Torres Rosa
Bought by
Coast Federal Bank Fsb
Purchase Details
Closed on
Oct 26, 1993
Sold by
Torres Florentino
Bought by
Torres Rosa and Torres Daniel
Create a Home Valuation Report for This Property
The Home Valuation Report is an in-depth analysis detailing your home's value as well as a comparison with similar homes in the area
Home Values in the Area
Average Home Value in this Area
Purchase History
| Date | Buyer | Sale Price | Title Company |
|---|---|---|---|
| 11128 S Budlong Llc | $820,000 | Progressive Title Company | |
| Balow Paul | $245,000 | Fidelity National Title Co | |
| Avondale Inc | $210,000 | Fidelity National Title Ins | |
| Equicredit Corp Of America | -- | Fidelity National Title Ins | |
| California/Equicredit Corp | $239,900 | United Title Company | |
| Houston Charles | $250,000 | American Title Co | |
| Crouse Jack R | -- | South Coast Title Company | |
| Weirick Kristen Diane | $155,000 | Stewart Title | |
| Coast Federal Bank Fsb | $226,546 | Chicago Title Company | |
| Torres Rosa | -- | -- |
Source: Public Records
Mortgage History
| Date | Status | Borrower | Loan Amount |
|---|---|---|---|
| Previous Owner | 11128 S Budlong Llc | $656,000 | |
| Previous Owner | Balow Paul | $232,750 | |
| Previous Owner | Avondale Inc | $170,000 | |
| Previous Owner | Houston Charles | $225,000 | |
| Previous Owner | Crouse Jack R | $25,000 | |
| Previous Owner | Weirick Kristen Diane | $131,750 |
Source: Public Records
Tax History Compared to Growth
Tax History
| Year | Tax Paid | Tax Assessment Tax Assessment Total Assessment is a certain percentage of the fair market value that is determined by local assessors to be the total taxable value of land and additions on the property. | Land | Improvement |
|---|---|---|---|---|
| 2025 | $12,781 | $914,721 | $803,171 | $111,550 |
| 2024 | $12,781 | $896,786 | $787,423 | $109,363 |
| 2023 | $12,577 | $879,203 | $771,984 | $107,219 |
| 2022 | $12,024 | $861,965 | $756,848 | $105,117 |
| 2021 | $11,898 | $845,064 | $742,008 | $103,056 |
| 2020 | $11,983 | $836,400 | $734,400 | $102,000 |
| 2019 | $5,823 | $324,441 | $238,370 | $86,071 |
| 2018 | $5,628 | $318,081 | $233,697 | $84,384 |
| 2016 | $5,365 | $305,731 | $224,623 | $81,108 |
| 2015 | $5,294 | $301,139 | $221,249 | $79,890 |
| 2014 | $5,310 | $295,242 | $216,916 | $78,326 |
Source: Public Records
Map
Nearby Homes
- 11126 Van Buren Ave
- 11116 Berendo Ave
- 1115 W 111th St
- 11137 7 van Buren Ave
- 11143 Van Buren Ave
- 1044 W 110th St
- 11100 S New Hampshire Ave
- 11414 S Budlong Ave Unit 8
- 11134 S Vermont Ave Unit 104
- 1303 W 109th Place
- 1212 W 107th St
- 760 W 110th St
- 1036 W 107th St
- 1424 W 113th St
- 1445 W 110th Place
- 730 W 111th St
- 1052 W 106th St
- 732 W Imperial Hwy
- 1519 W 111th St
- 764 W 107th St
- 11128 - 11132 S Budlong Ave
- 11134 S Budlong Ave
- 11126 S Budlong Ave
- 11138 S Budlong Ave
- 11116 S Budlong Ave
- 11144 S Budlong Ave
- 11131 Berendo Ave
- 11139 Berendo Ave
- 11127 Berendo Ave
- 11112 S Budlong Ave
- 11150 S Budlong Ave
- 11137 Budlong Ave
- 11147 Berendo Ave Unit Back
- 11147 Berendo Ave
- 11119 Berendo Ave
- 11131 S Budlong Ave
- 11133 S Budlong Ave
- 11125 S Budlong Ave
- 11141 Budlong Ave
- 11149 Berendo Ave